Radial Sankey
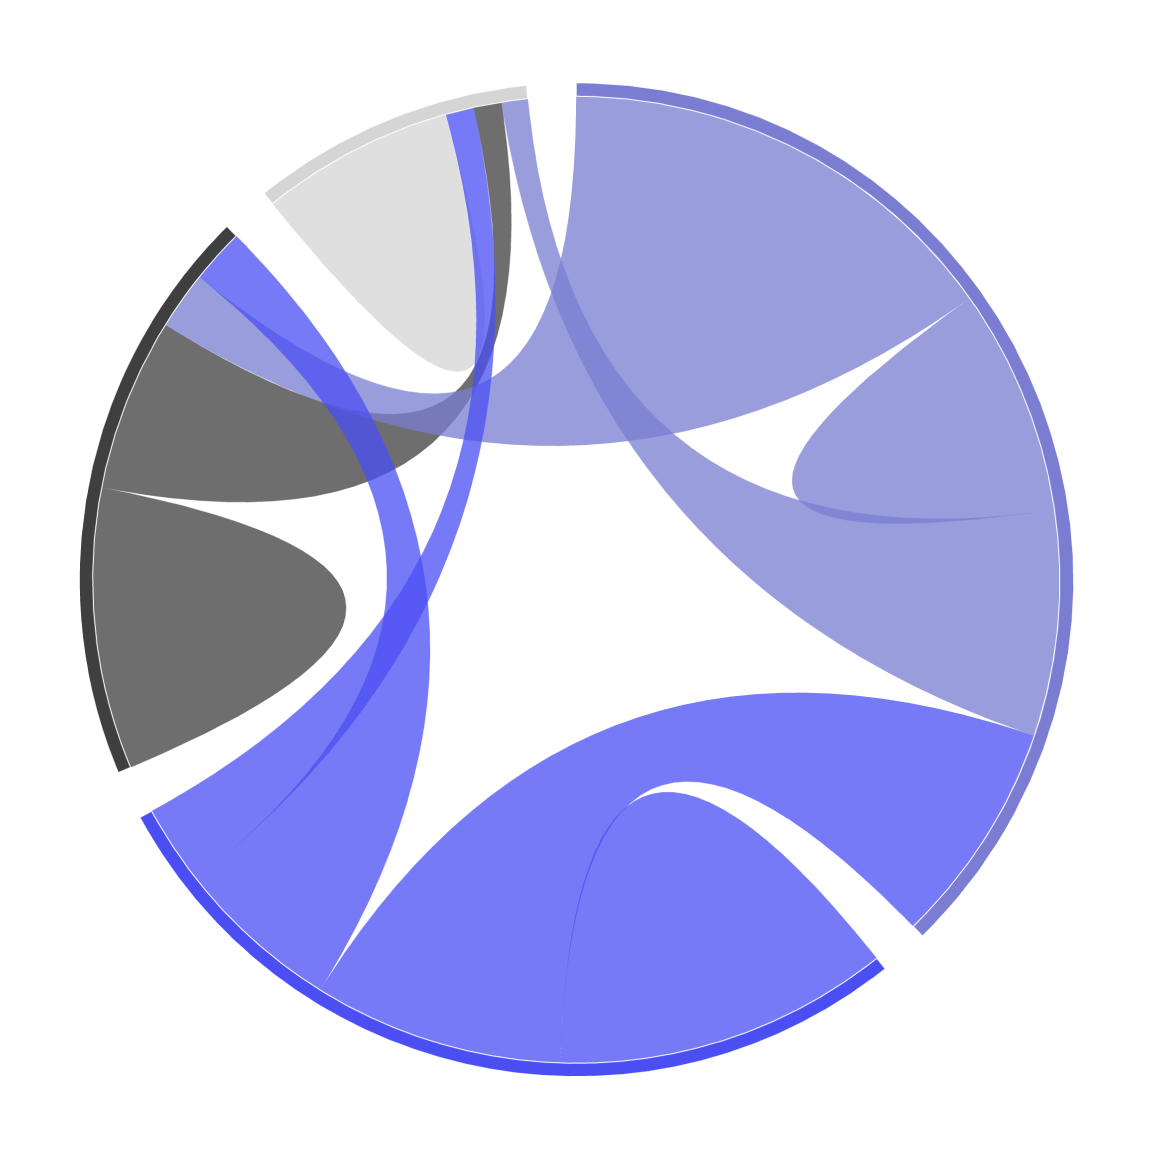
Transform your data into beautiful and insightful Radial Sankey
Trusted by 1000+ teams, including Tableau themselves.






About Radial Sankey
Elevate your data storytelling with the Radial Sankey Extension for Tableau, designed to transform how you visualize interactions between sources and targets. This powerful tool turns your data into a striking circular Sankey diagram, offering a comprehensive view of relationships and flows in an intuitive, circular format.
The Radial Sankey chart excels at illustrating interconnections in a compact, circular layout, making it ideal for spotting patterns, strengths, and bottlenecks in data flows. This format not only conserves space but also improves readability and engagement by providing a 360-degree perspective of data interactions.
See Radial Sankey in action


Everything you need
- Customizable edge thickness and padding between nodes for enhanced storytelling
- Adjustable gaps between flows to emphasize relationships
- Flexible color and label options
When Radial Sankey shines
- Visualizing complex flow relationships
- Analyzing distribution patterns between categories
- Highlighting interconnected processes or data pathways
Setup in Tableau
Two short phases: add the Viz Extension to your workbook once, then drop the relevant fields on the new Marks Card.
Add the extension to Tableau
- Open the Marks card and choose Add Extension On any Tableau worksheet (Desktop, Cloud or Server), open the Marks card dropdown and select "Add Extension". A new dialog will list available Viz Extensions.
- Pick the Exchange listing or upload the .trex file Either choose "Access Extensions on the Exchange" for the free hosted build, or click "Access local extensions" and upload the .trex file you received with your LaDataViz license.
- Review and accept the data-access prompt Tableau will ask you to allow the extension to read the worksheet's aggregated data. Accept it — a new Viz Extension Marks Card will appear next to Color, Size, Tooltip, etc.
Configure Radial Sankey
- Drag a Dimension on Source and Target.
- Click Format Extension to configure colors, gaps, and labels.
Enterprise-grade by design
Every LaDataViz Viz Extension is built so your data never leaves Tableau. Here's exactly how we keep it that way.
Ready to add Radial Sankey to your dashboard?
Related viz extensions
Other extensions in the flow family.


Questions about Radial Sankey?
Thanks for reaching out! You'll hear back from me soon.
Oops! Something went wrong while submitting the form.
We use cookies to measure site usage with Google Analytics. No data is collected until you accept.