Radar
Create a beautiful and insightful Radar Chart in seconds
Trusted by 1000+ teams, including Tableau themselves.






About Radar
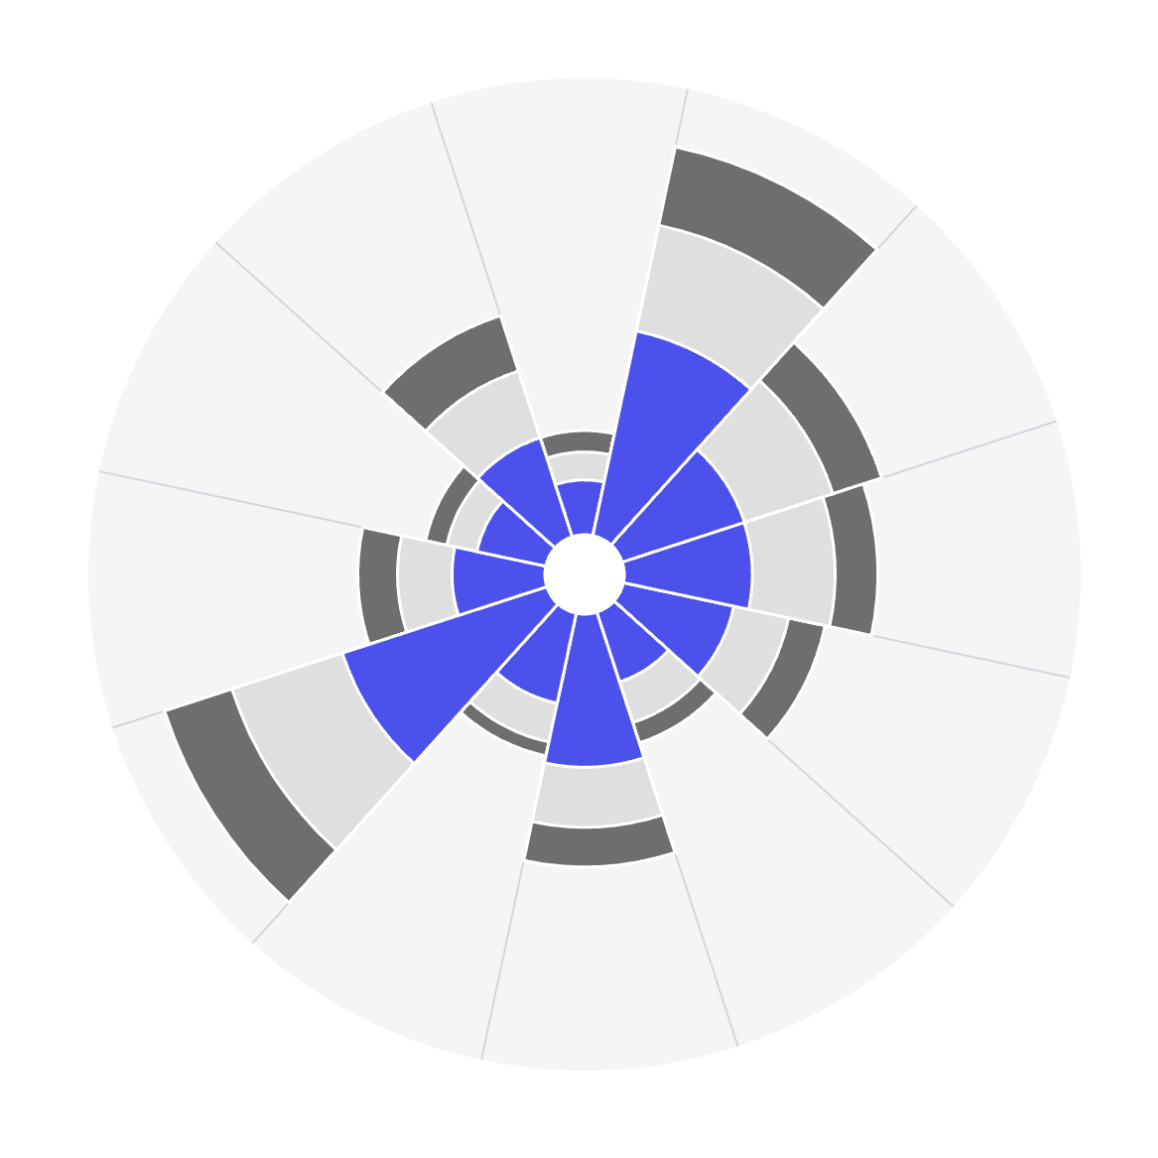
Enhance your data visualization capabilities with the Radar Chart Extension for Tableau, designed to provide a comprehensive view of multivariate data. This extension seamlessly integrates with Tableau to generate detailed radar (or spider) charts, ideal for comparing multiple variables across one or more groups within a dataset.
Radar charts excel at displaying performance metrics across various areas in a straightforward way that facilitates comparison. They enable viewers to quickly identify strengths and weaknesses at a glance, making them suitable for benchmarking, skills assessments, or any context where visual summaries of relative performance across categories are needed.
See Radar in action


Everything you need
- Dynamic or specified axis range for tailored data representation
- Optional markers to emphasize key data points
- Adjustable background grid for improved readability
- Customizable connecting line styles to suit personal data display
When Radar shines
- Comparing values with a focus on relative scale and position
- Visualizing data patterns and distributions around a central point
- Highlighting trends and variations across categories
Setup in Tableau
Two short phases: add the Viz Extension to your workbook once, then drop the relevant fields on the new Marks Card.
Add the extension to Tableau
- Open the Marks card and choose Add Extension On any Tableau worksheet (Desktop, Cloud or Server), open the Marks card dropdown and select "Add Extension". A new dialog will list available Viz Extensions.
- Pick the Exchange listing or upload the .trex file Either choose "Access Extensions on the Exchange" for the free hosted build, or click "Access local extensions" and upload the .trex file you received with your LaDataViz license.
- Review and accept the data-access prompt Tableau will ask you to allow the extension to read the worksheet's aggregated data. Accept it — a new Viz Extension Marks Card will appear next to Color, Size, Tooltip, etc.
Configure Radar
- Drag a Dimension on Spokes and a Measure on Values.
- Click Format Extension to configure markers, grid, and line styles.
Enterprise-grade by design
Every LaDataViz Viz Extension is built so your data never leaves Tableau. Here's exactly how we keep it that way.
Ready to add Radar to your dashboard?
Related viz extensions
Other extensions in the comparison family.
Questions about Radar?
Thanks for reaching out! You'll hear back from me soon.
Oops! Something went wrong while submitting the form.
We use cookies to measure site usage with Google Analytics. No data is collected until you accept.