An independent studio for data visualization.
Tools, plugins, and consulting that shape the future.
Trusted by 1000+ teams, including Tableau themselves.


We won the 2026 Tableau Hackathon
We just took home the Tableau Hackathon prize with Vizuall, an experimental new way to explore Tableau data. Read how we built it, then try it yourself.
Premium tools
Three flagship products that speed up your Tableau workflow, from design handoff to advanced charts to automated KPIs.
 Only at LaDataViz
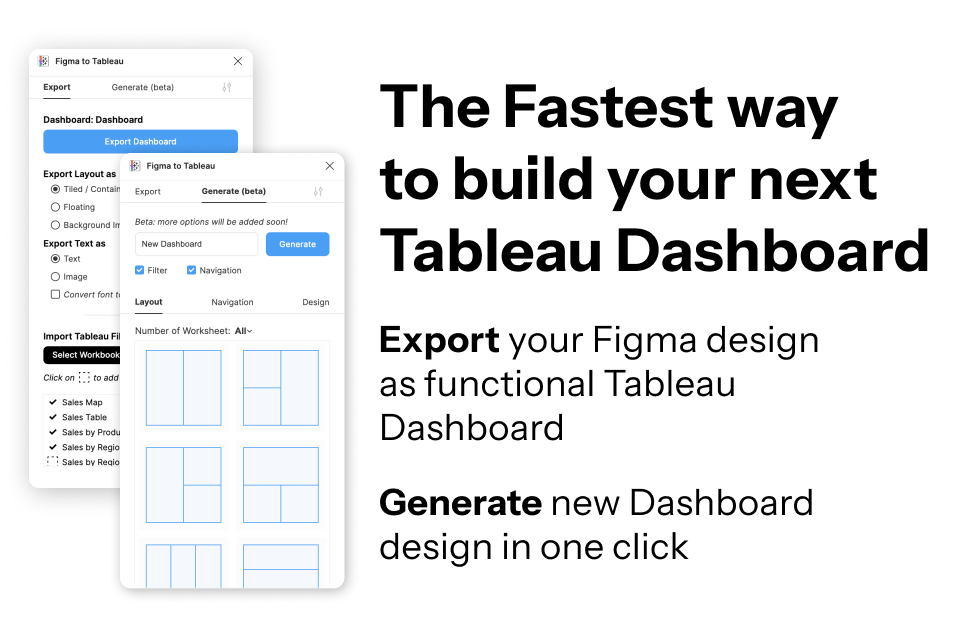
Figma to Tableau
Transform your Figma designs into Tableau dashboards with a single click. Skip hours of rebuilding and tedious setup.
 21+ New Charts
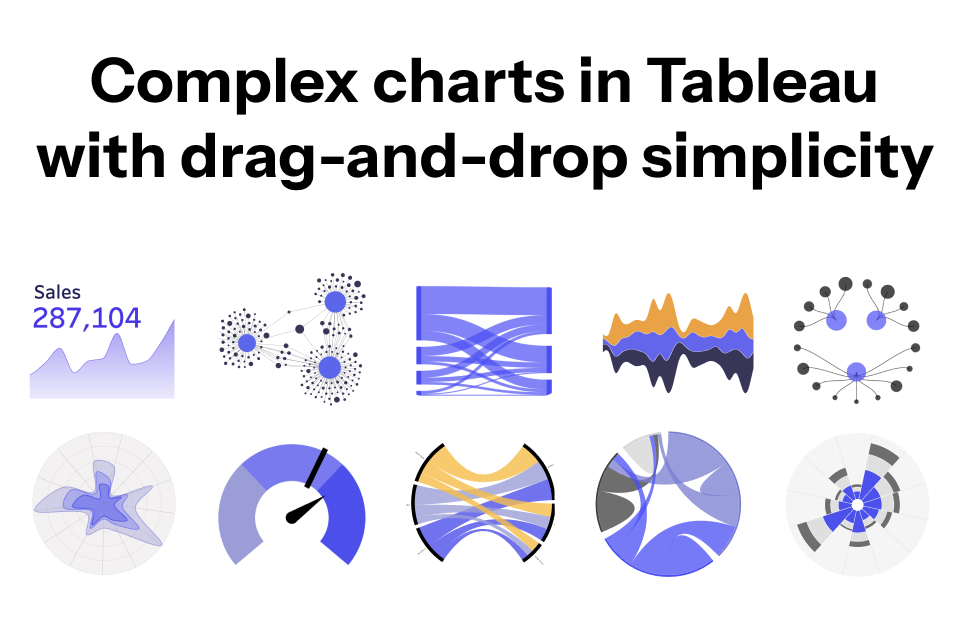
Viz Extensions
Drag-and-drop chart types for Tableau dashboards. No templates, no calculations needed.
 Automated KPI
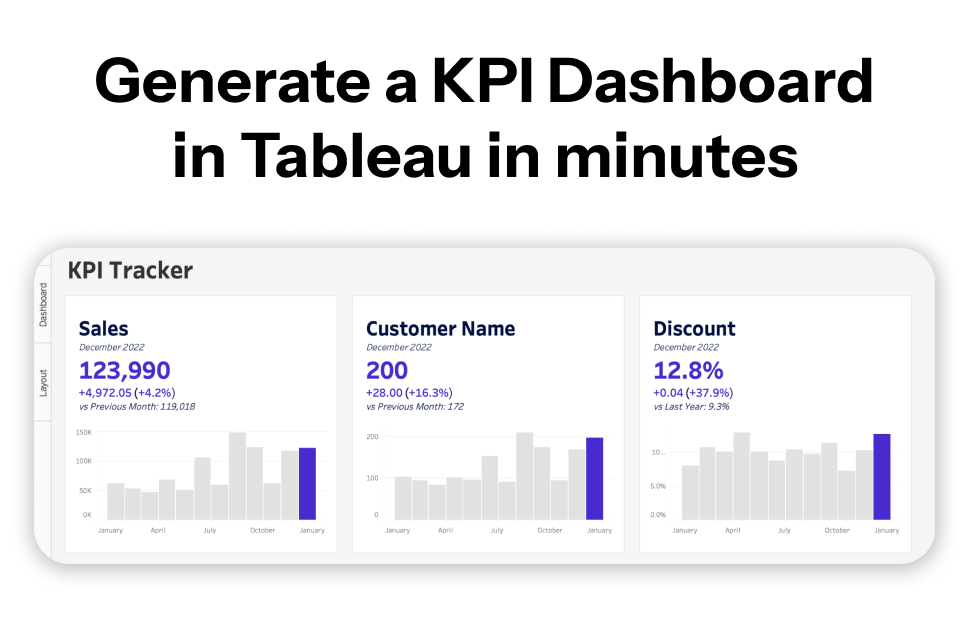
BANg
Create a complete KPI dashboard with all calculations in one click. Perfect for executive dashboards.
Start for free
Three completely free apps you can use today.
 Free
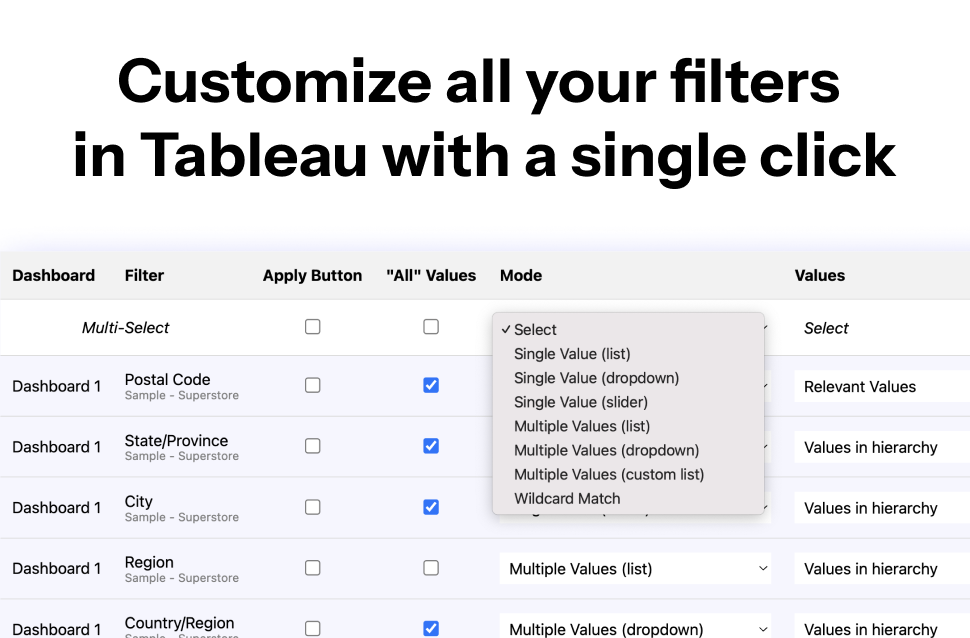
FreeFilter Manager
Customize every Tableau filter at once. Add apply buttons, restyle headers, and keep your dashboards consistent.
 Free
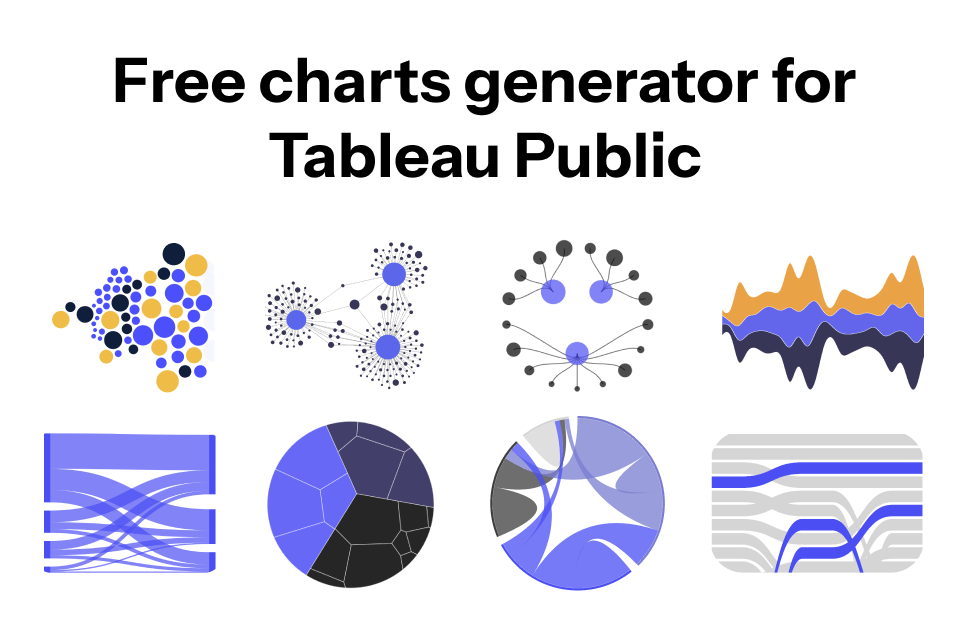
FreeAdvViz
Free web generator for Tableau Public. Export to Tableau, CSV, and SVG in one click.
 Free
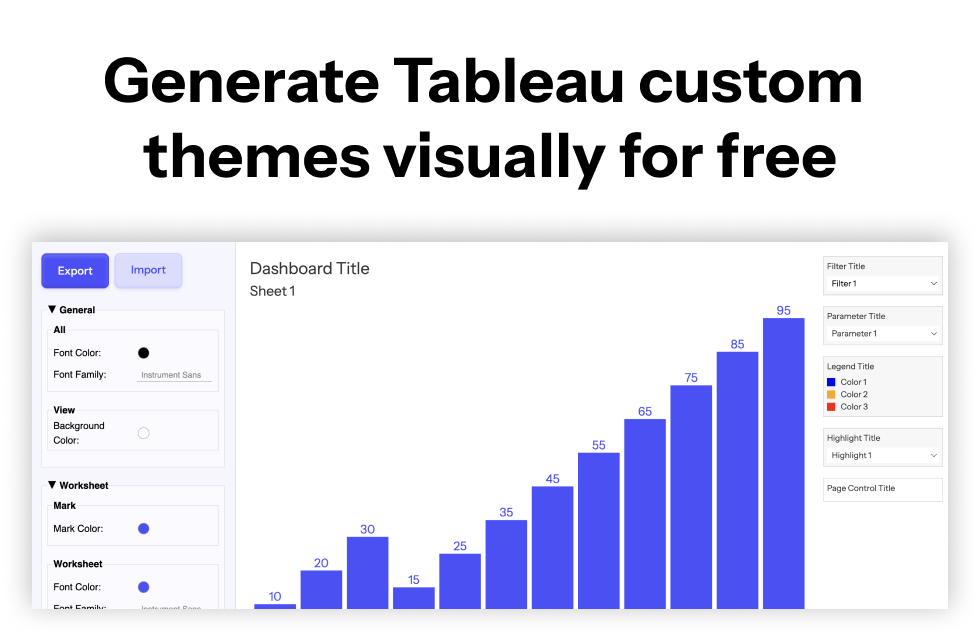
FreeTheme Generator
Design a polished Tableau theme visually (colors, fonts, shadows) and download the matching .tps file.
Built for every industry
From Fortune 500 consulting firms to global research universities, our tools and consulting work travel across sectors.
-
Consulting & Professional Services
McKinsey, Accenture, Oliver Wyman, ICF
-
Healthcare & Pharma
Pfizer, Takeda, Guardant Health, Delta Dental
-
Public Sector & NGO
USAID, WIPO (UN), Nashville.gov
-
Sports & Entertainment
NBA, 2K Games, Newcastle United FC, Wargaming
-
Education & Research
Harvard, Stanford, Cambridge, Michigan
-
Retail, Media & Tech
Salesforce, Aldi, Nielsen, Check24, Udacity
Trusted by 1000+ customers
Including Tableau themselves


-
Official Tableau Partner
Listed on the Tableau Exchange
-
First-ever Trusted Partner
Our extensions code has been carefully reviewed by Tableau
-
On-premise available
Self-host any tool on your servers
-
Privacy-first
Your data never leaves your browser
A decade of craft.


LaDataViz is a two-person studio led by Tristan Guillevin & Jessica Bautista. Tristan is a Tableau Visionary, Iron Viz champion, and Tableau Ambassador, recognitions reserved for a handful of practitioners worldwide. Jessica is a DataDev Ambassador with a deep design eye for data products, and leads our consulting projects.
We ship the tools we wish existed when we worked inside dashboard teams. Every product solves a real workflow problem we hit ourselves, from rebuilding a Figma design in Tableau (now a one-click plugin), to drawing a Sankey or Network chart without endless calculations (now drag-and-drop Viz Extensions).
When teams need something bespoke, we consult hands-on: custom dashboards, design systems, advanced visualizations, and team training.
Need something tailored for you?
We design, build, and ship data products for teams that want their dashboards to feel as good as the rest of their software.


Learn data visualization with us
Two creators sharing one decade of dataviz lessons across every format.

Newsletter
One short email every two weeks with new tools, viz tips, and a free download. Join 3000+ subscribers.

YouTube
Tutorials, technique deep-dives, and tool demos to level up your dataviz skills.
Watch on YouTube →
Past issues
Browse every past edition of our newsletter for viz tips, tool releases, and free downloads.
Read on Uncharted →Let's discuss something great.
Thanks for reaching out! You'll hear back from me soon.
Oops! Something went wrong while submitting the form.
Frequently asked questions
What is LaDataViz?
Which tools do you currently make?
Do you only build for Tableau?
Are any of your tools free?
How does pricing work?
Do you offer custom consulting?
How can I learn data visualization from you?
How do I get support?
We use cookies to measure site usage with Google Analytics. No data is collected until you accept.