


-
Official Tableau Partner
Listed on the Tableau Exchange
-
First-ever Trusted Partner
Our extensions code has been carefully reviewed by Tableau
-
On-premise available
Self-host any tool on your servers
-
Privacy-first
Your data never leaves your browser
Beautiful. Powerful. Easy.
Unlock powerful new visualization capabilities in Tableau.
Create stunning charts and graphs with a simple drag-and-drop.
See the magic happen in our quick demo video:
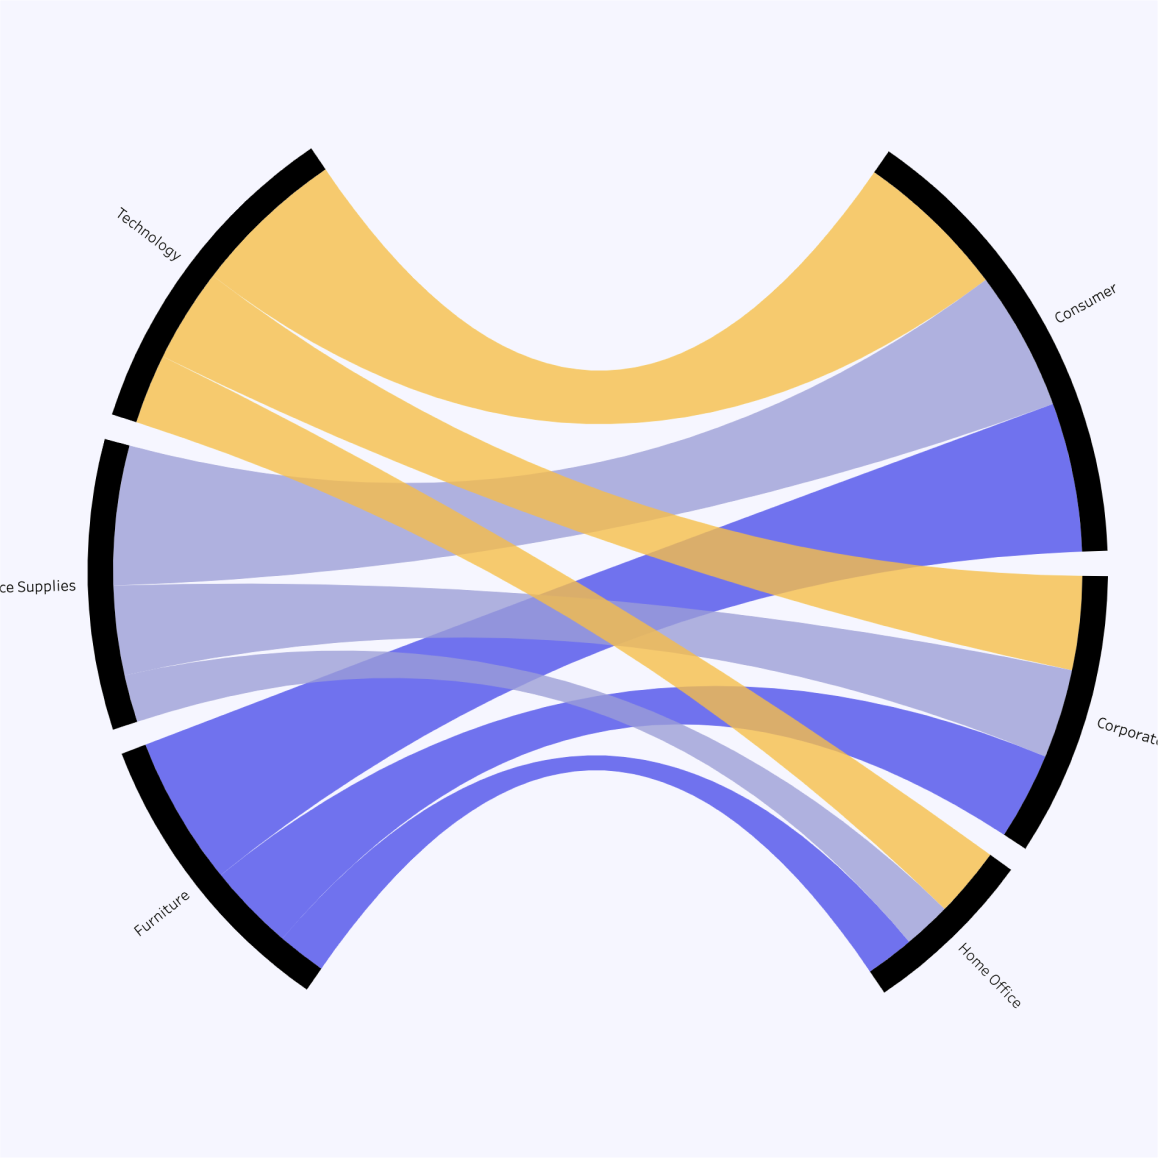
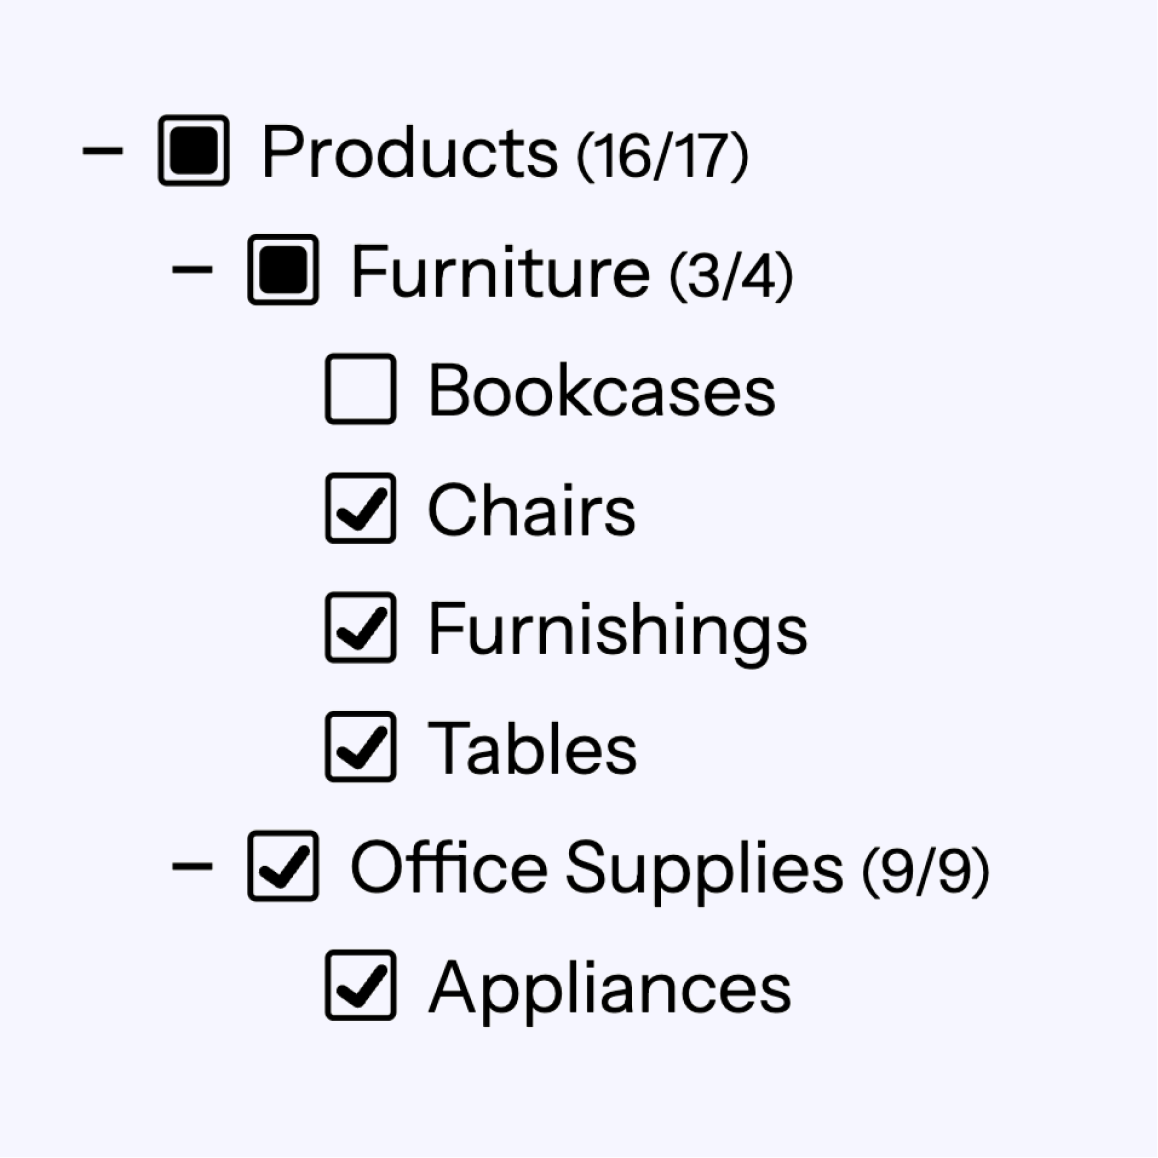
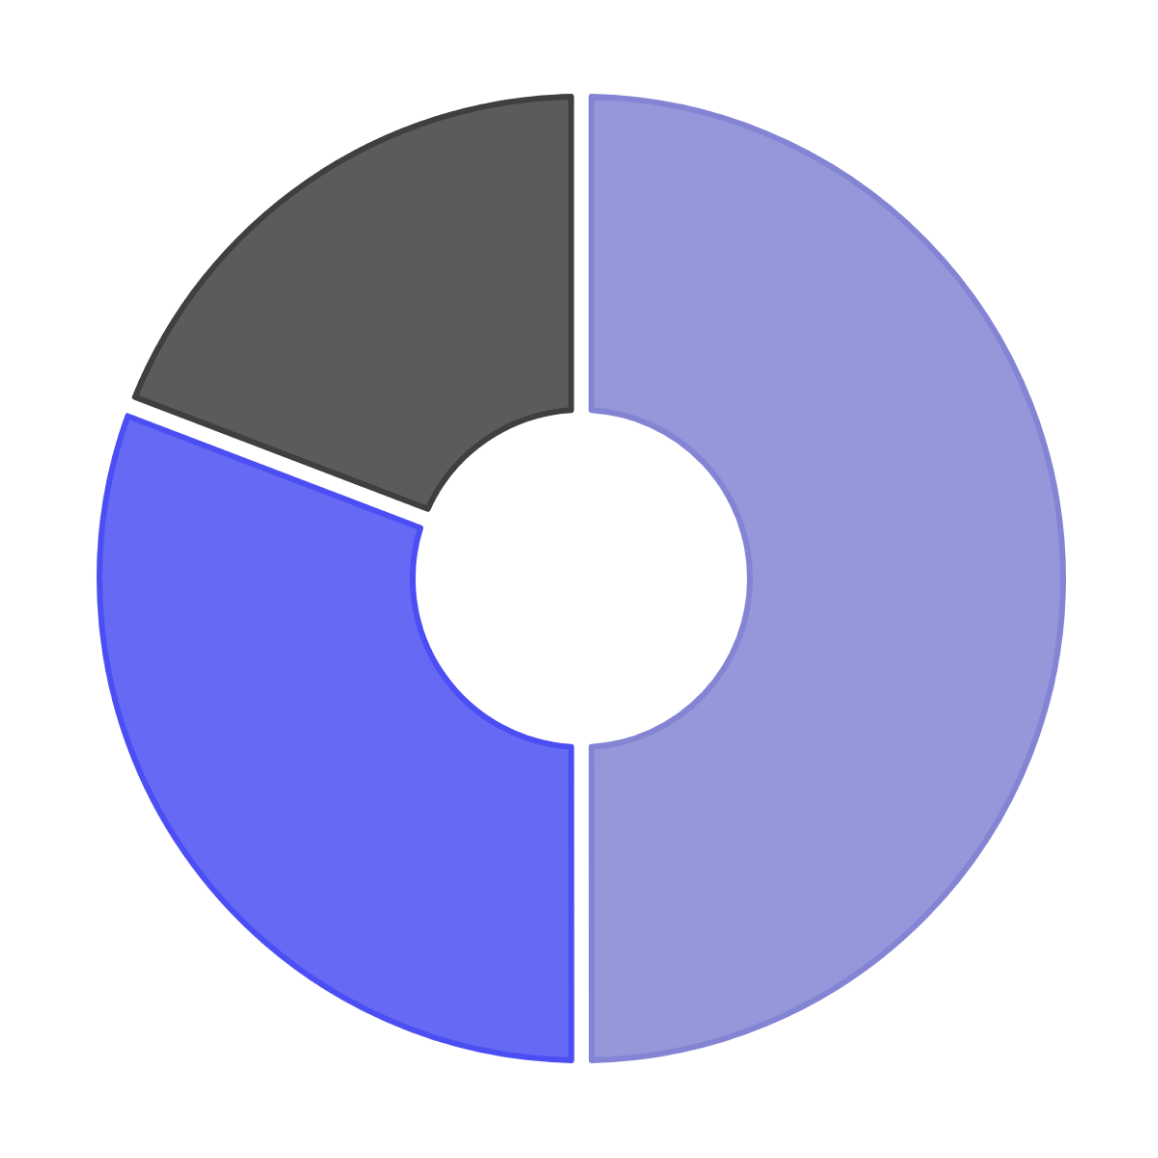
Building complex charts has never been that easy
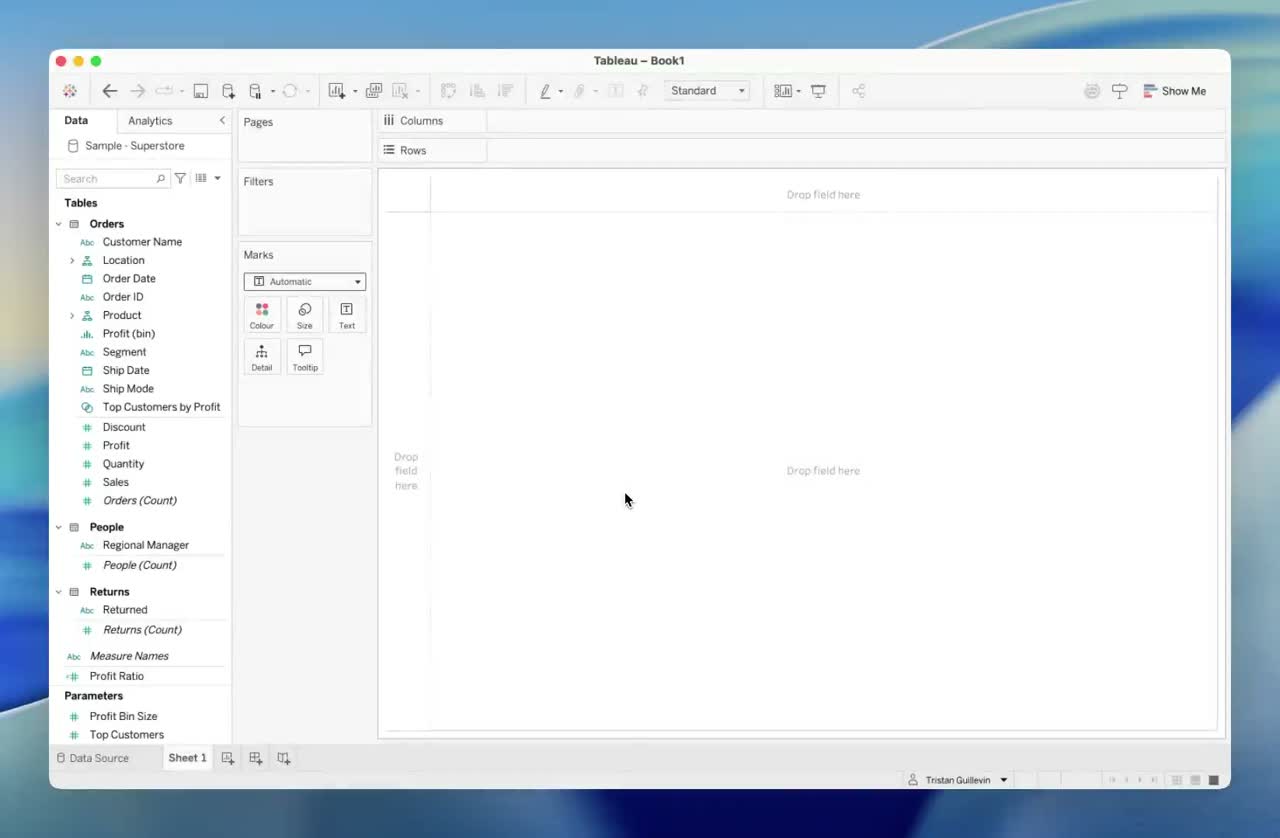
Choose your Viz Extension
Starting in Tableau 2024.2, you find the Add Extensions button directly
in the Marks selector.
Select either one of the free extensions available on the Tableau Exchange or use a local .trex file if you already have one.
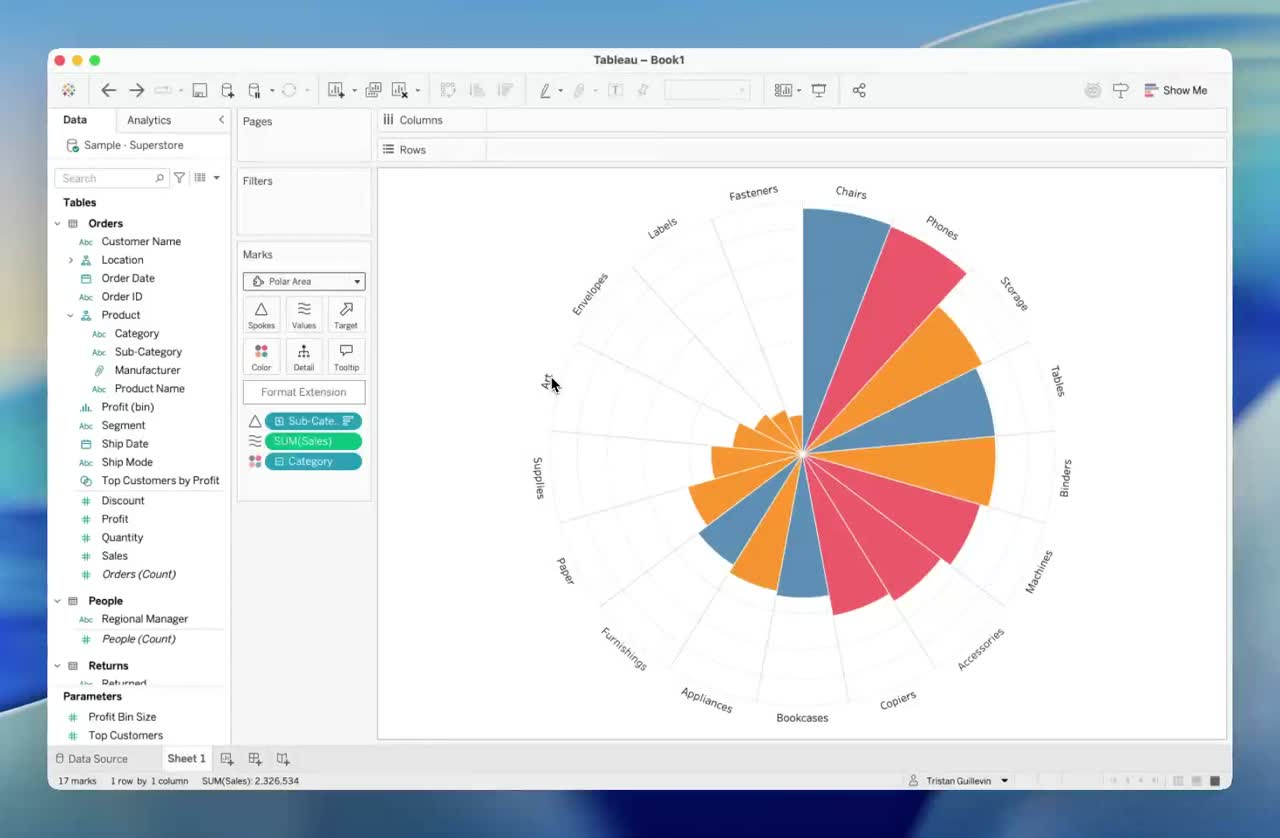
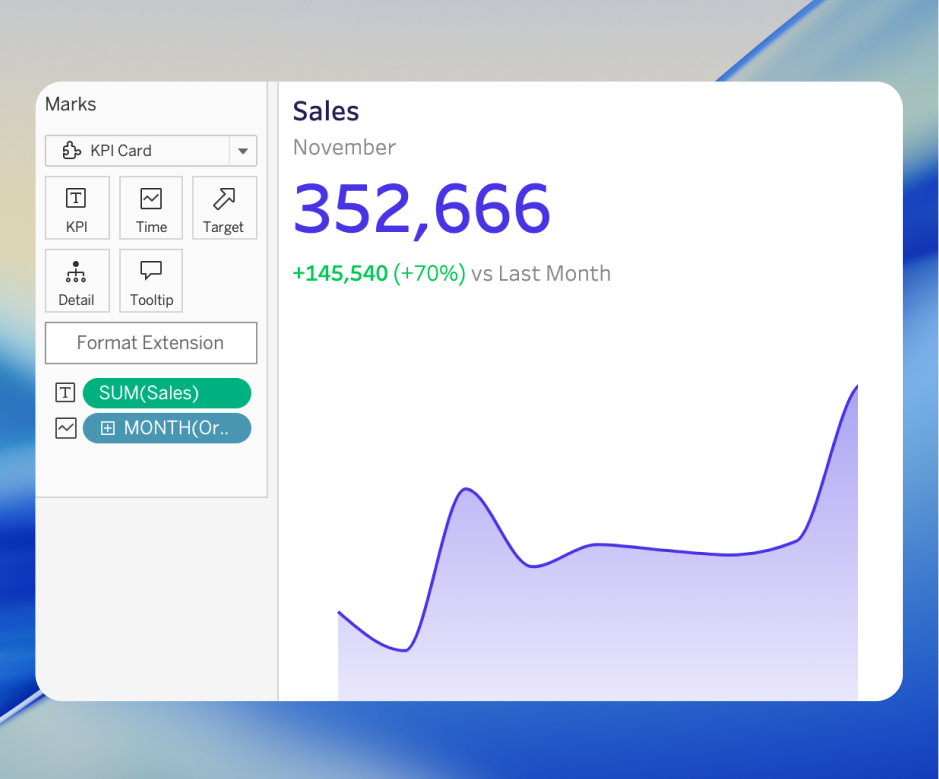
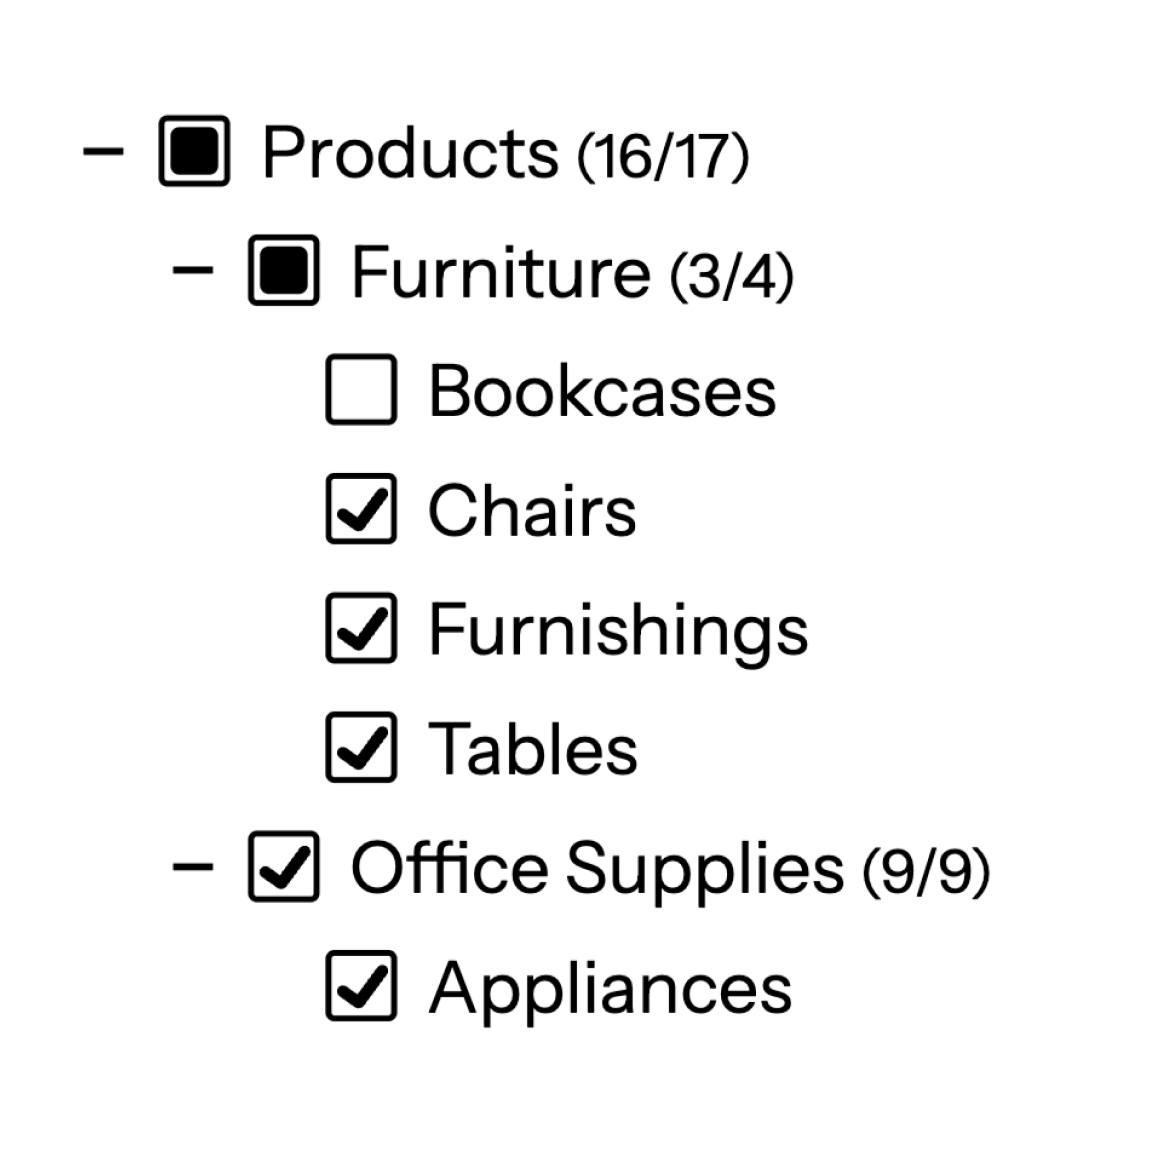
Create your visualization
Follow the instructions in the extension to create your chart.
With one or two drag-and-drop, you can create a beautiful chart.
No need to write any calculations or use templates.
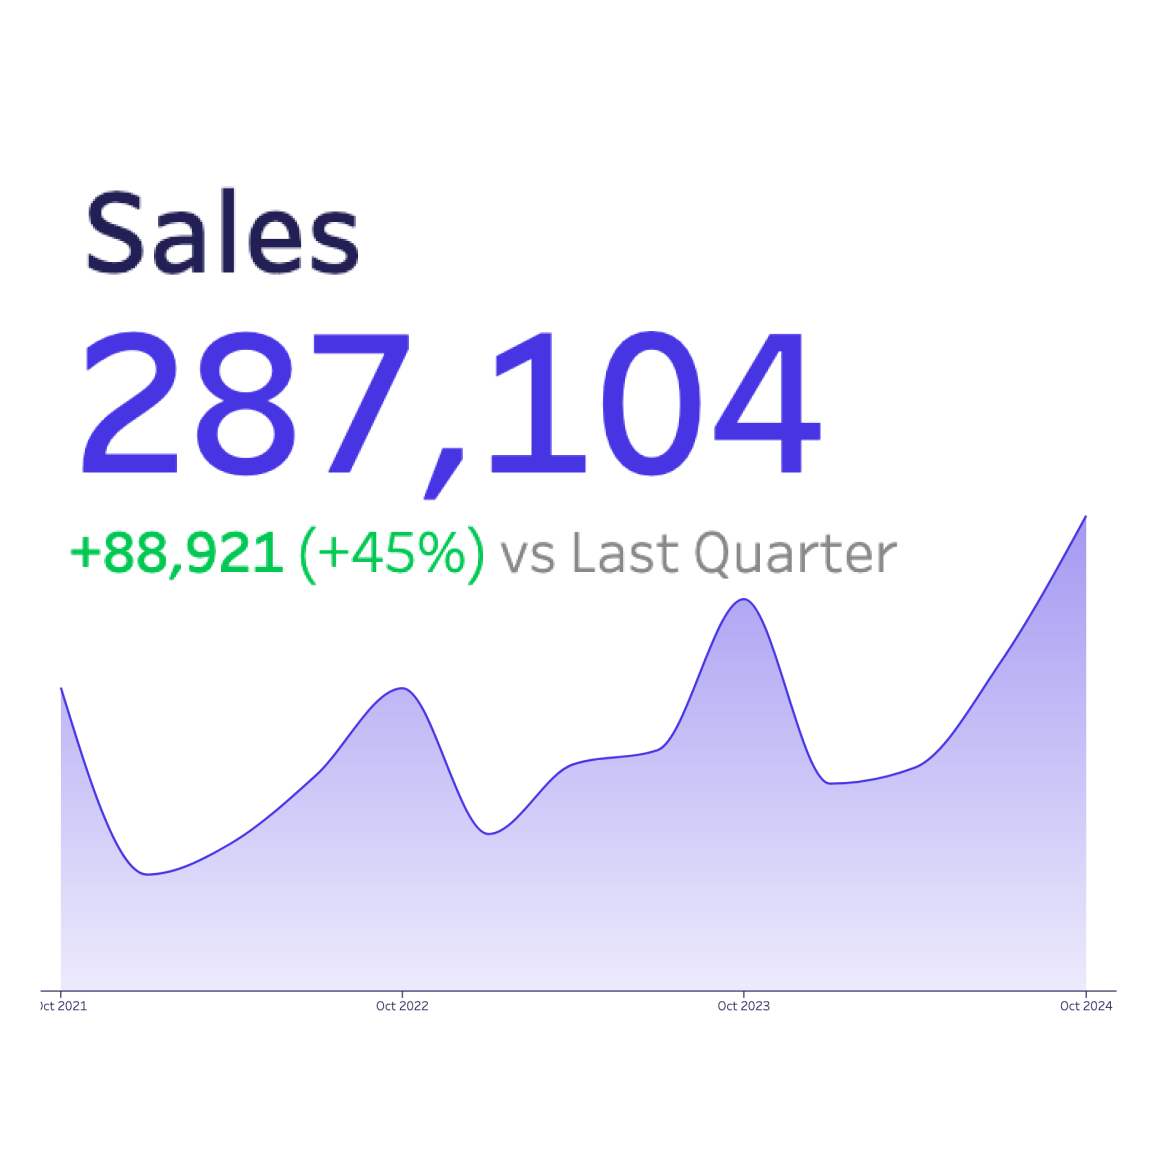
The chart is connected to the data and will update automatically. You can use filters, parameters,
and actions as usual.
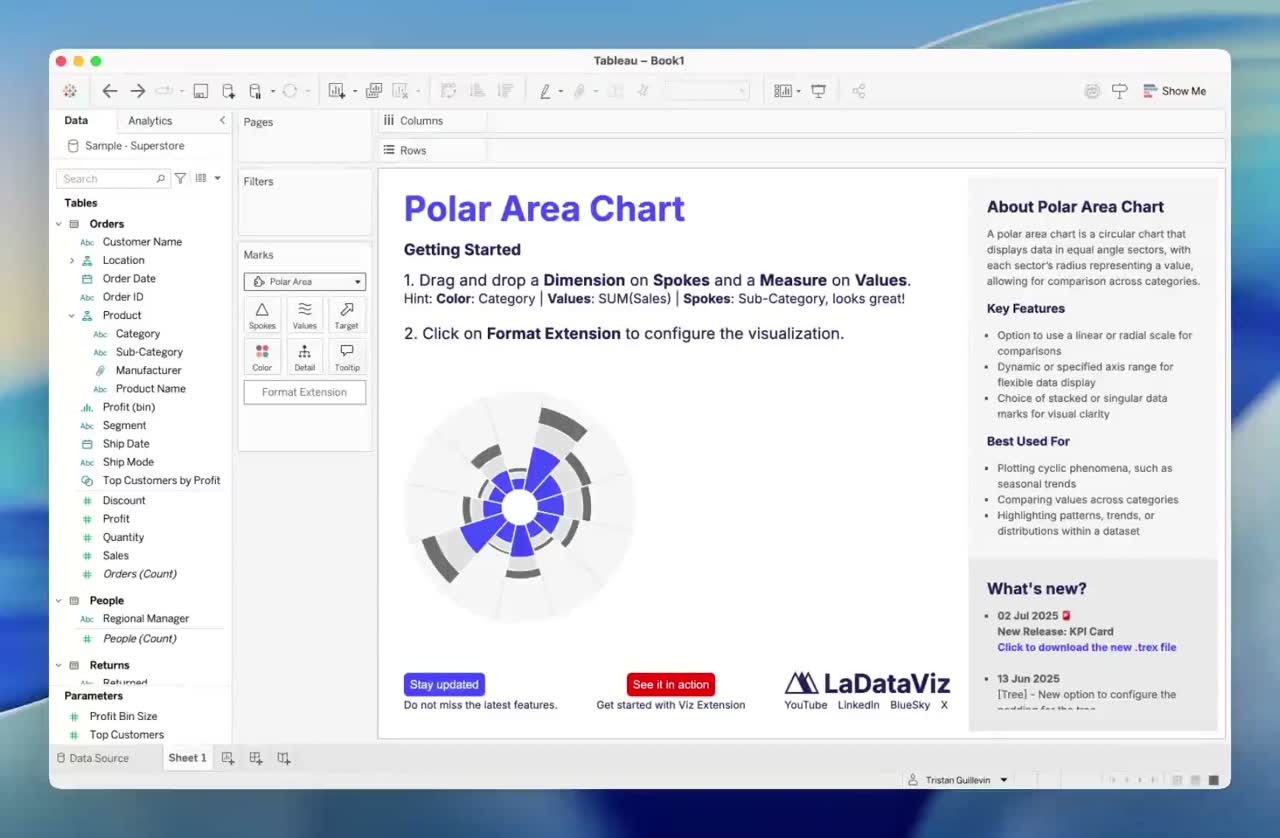
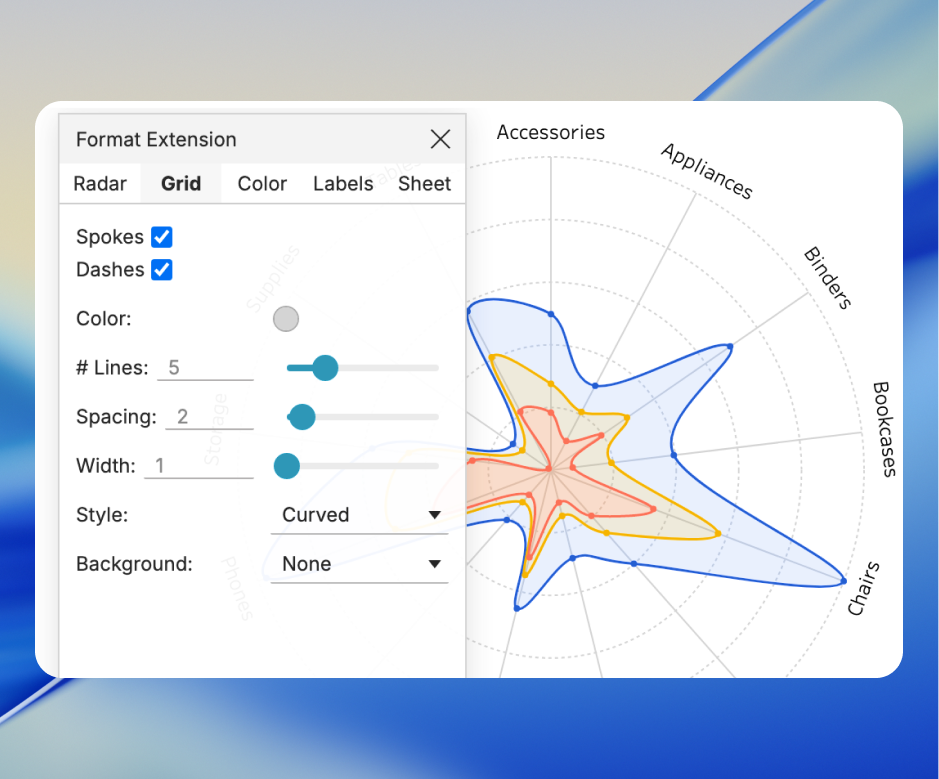
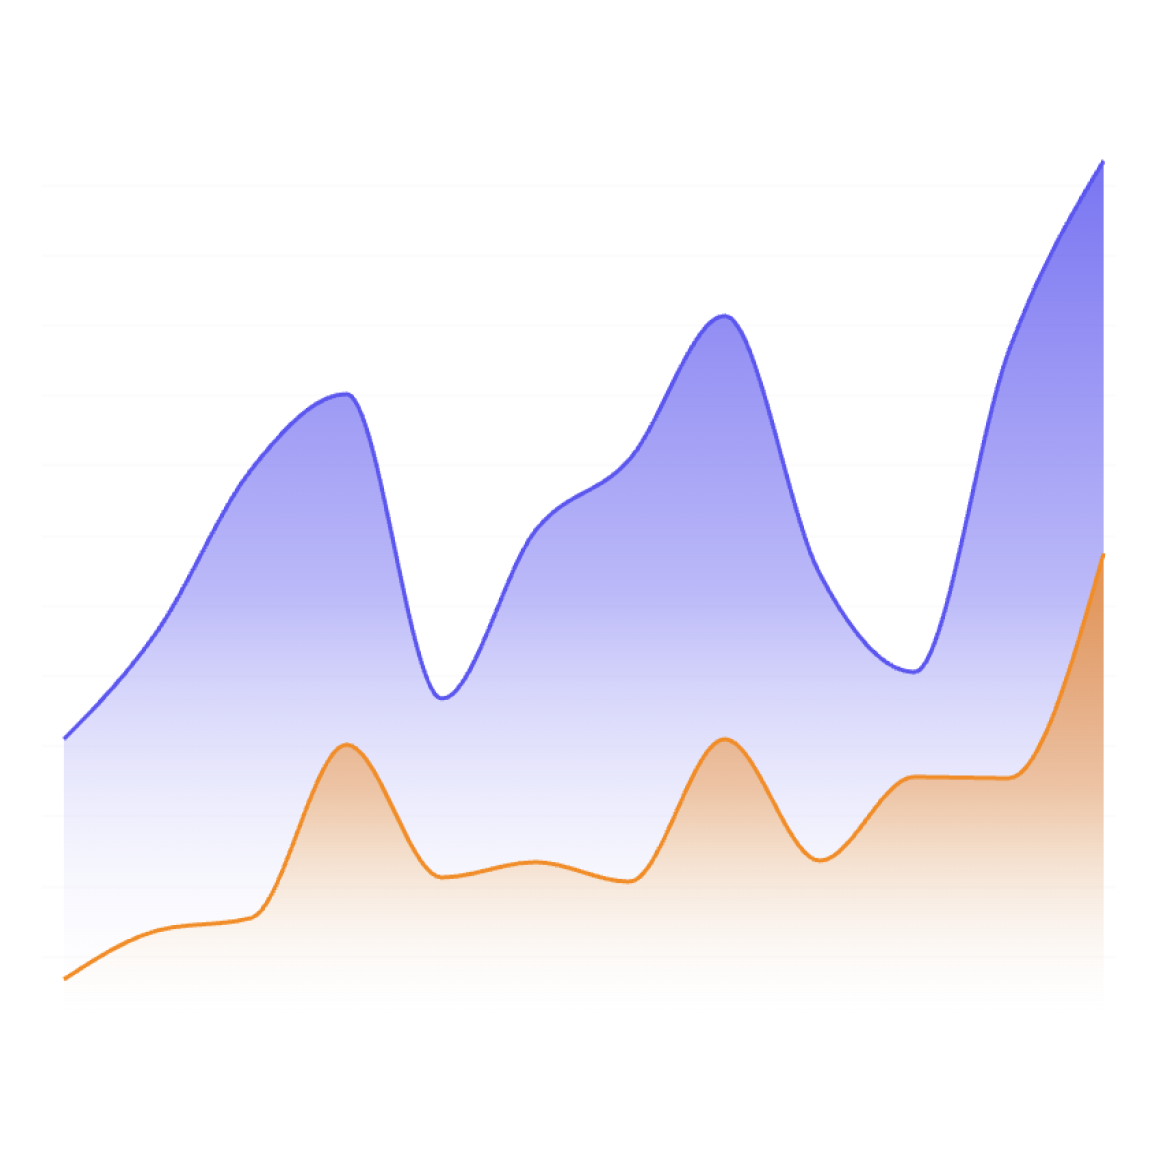
Format as you want
Click on the Format Extension button to open a new window configuration
window.
Each extension has its own format options with many ways to customize your chart.
Tip: Customizations are automatically saved when you close the Format Extension
window.
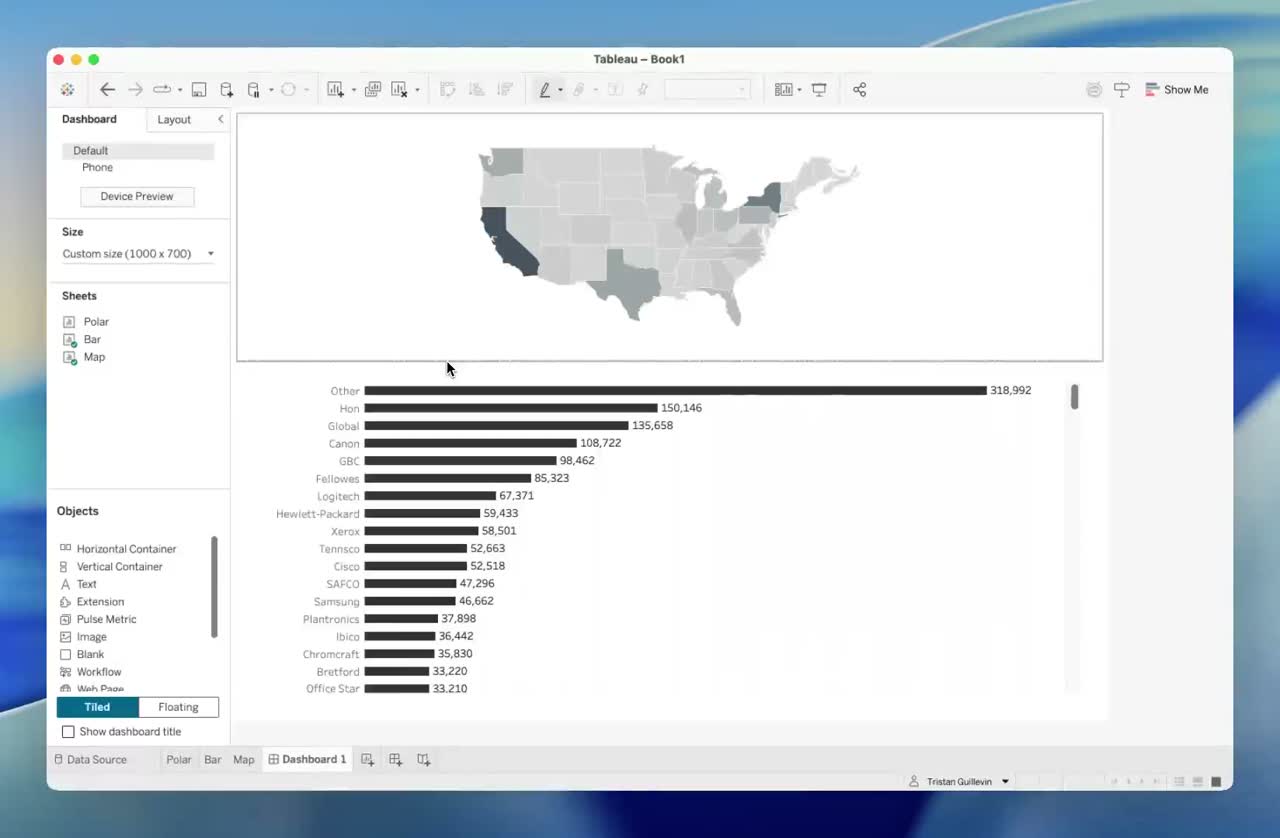
Use it in your dashboard
You can use the extension in your dashboard as any other worksheet.
Use the quick filter action button to start using the new chart as a filter.
That's it! You just created and used an advanced chart in Tableau in a few minutes.
Discover all our extensions
Check our catalogWe take care of the hard parts
so you can focus on the fun parts

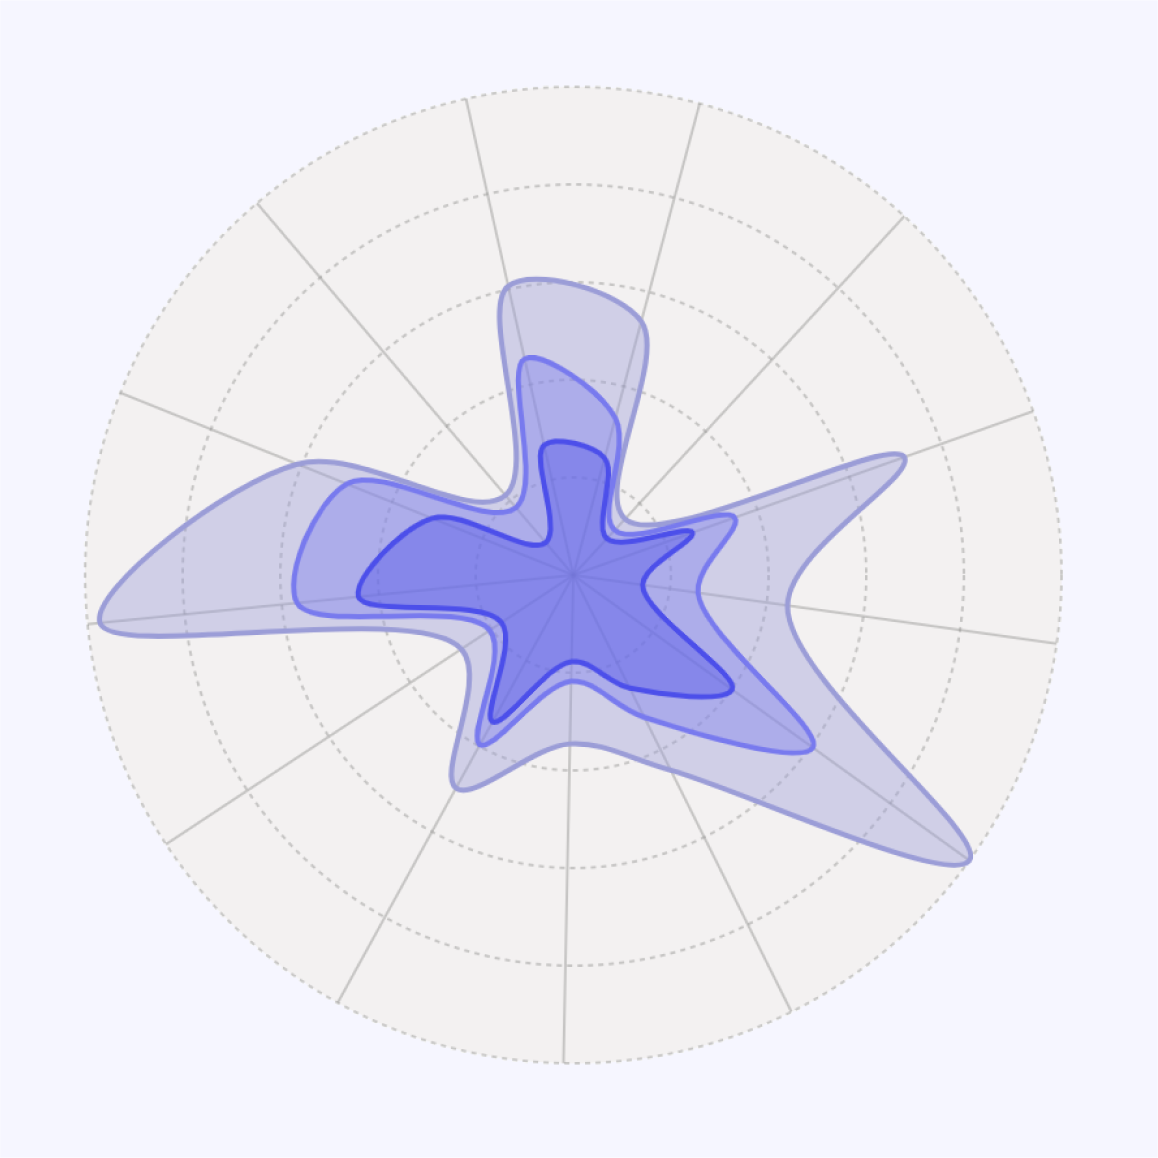
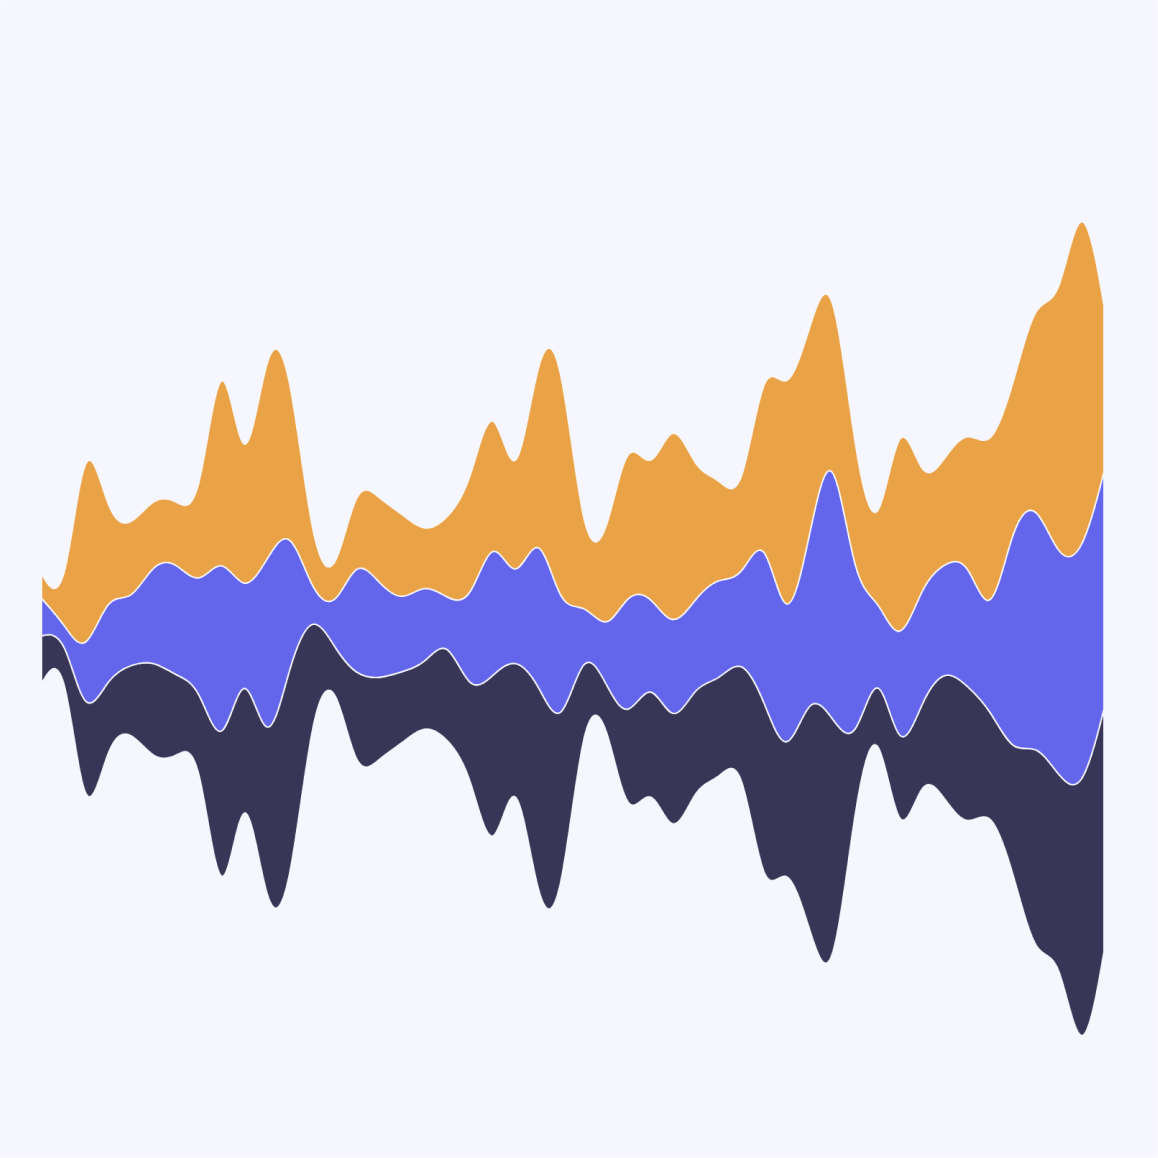
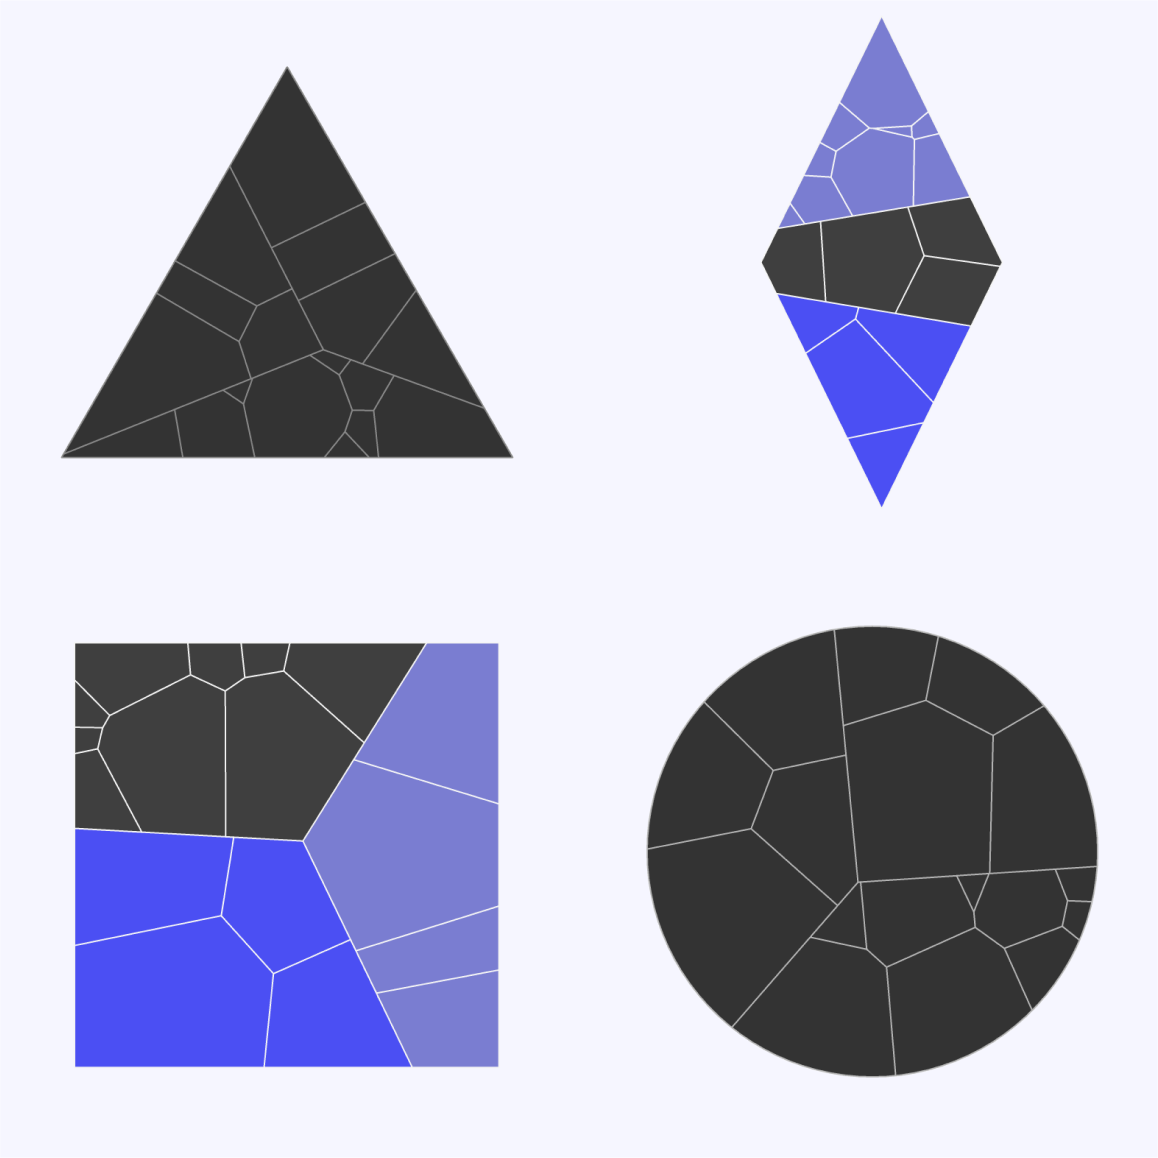
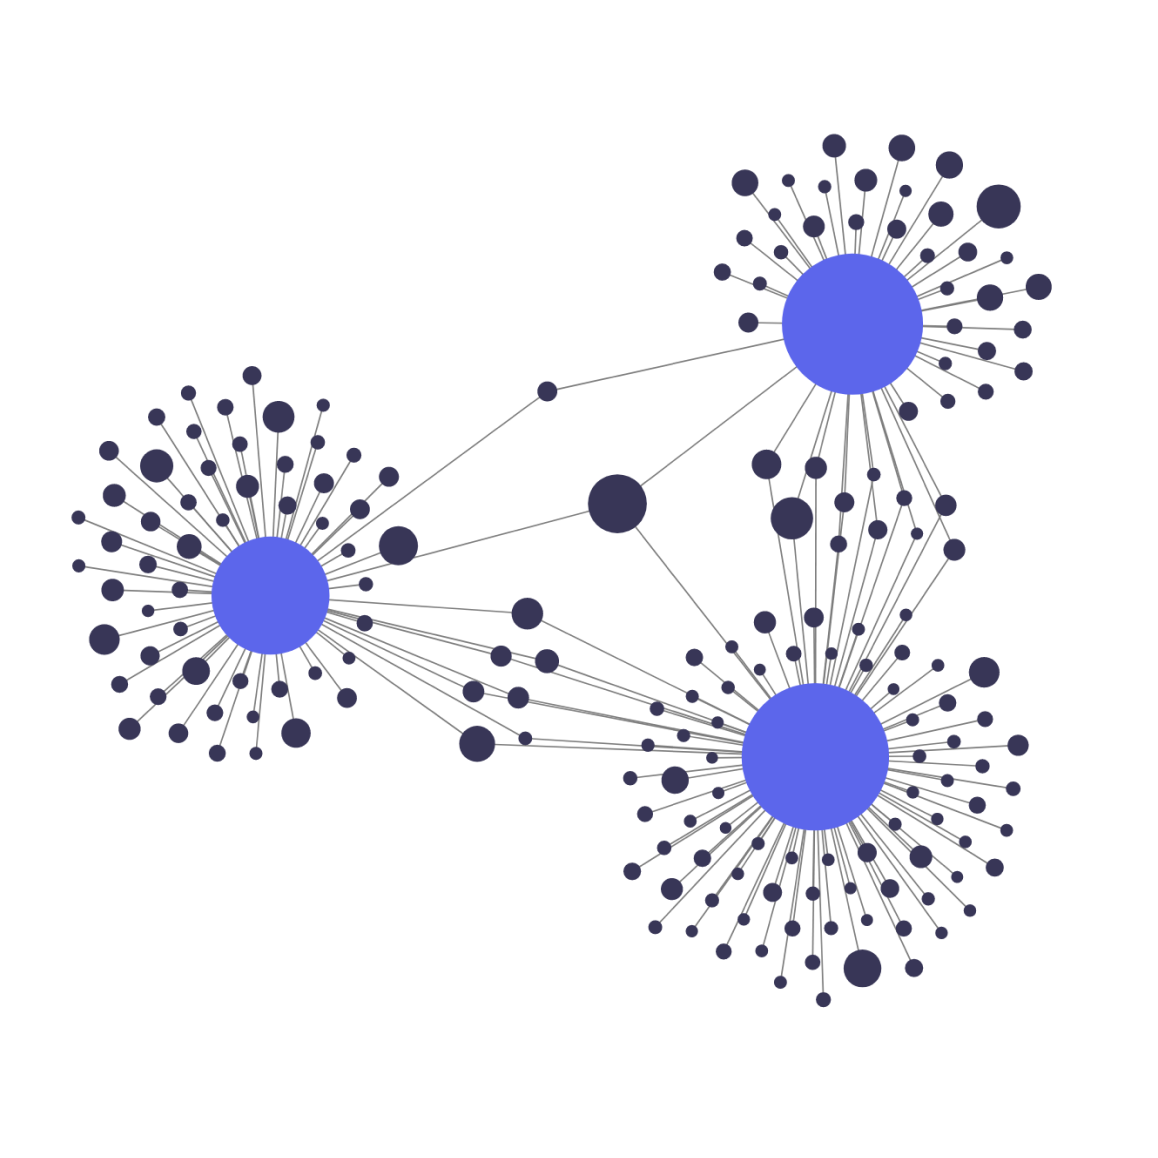
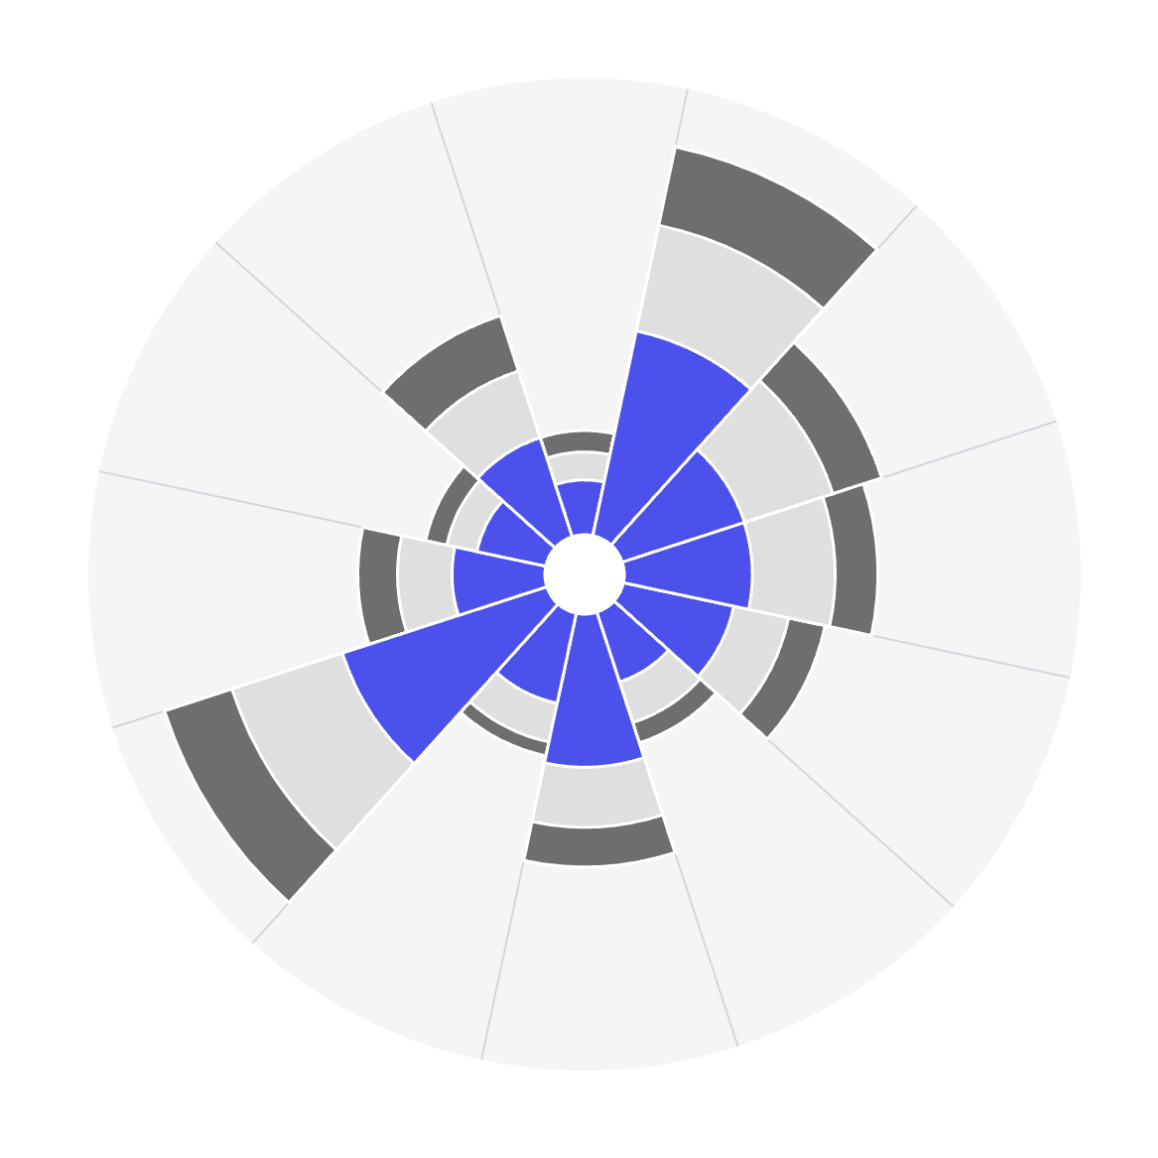
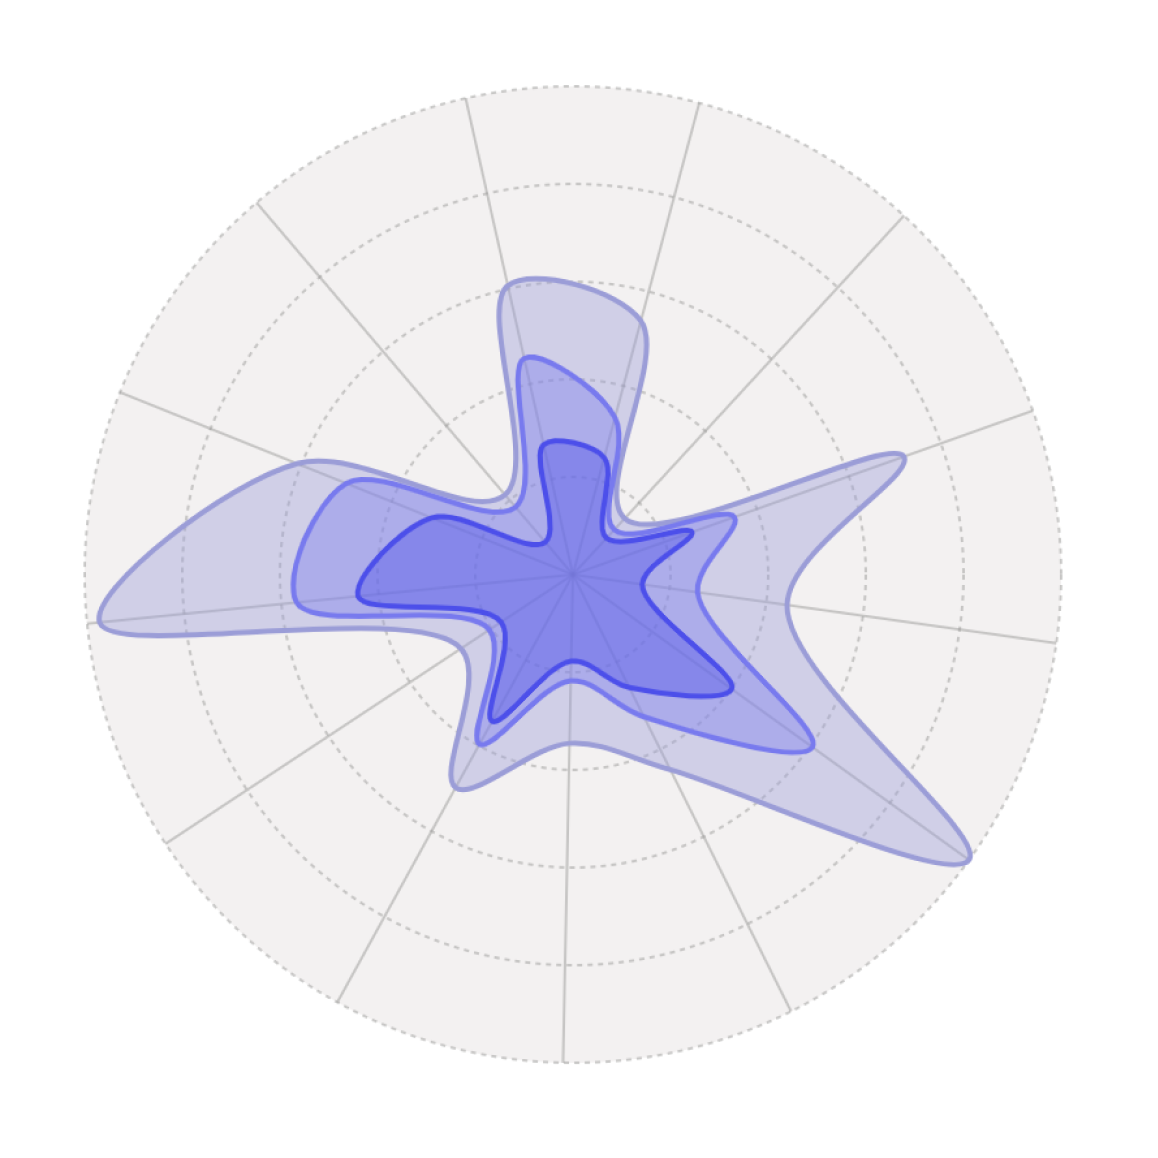
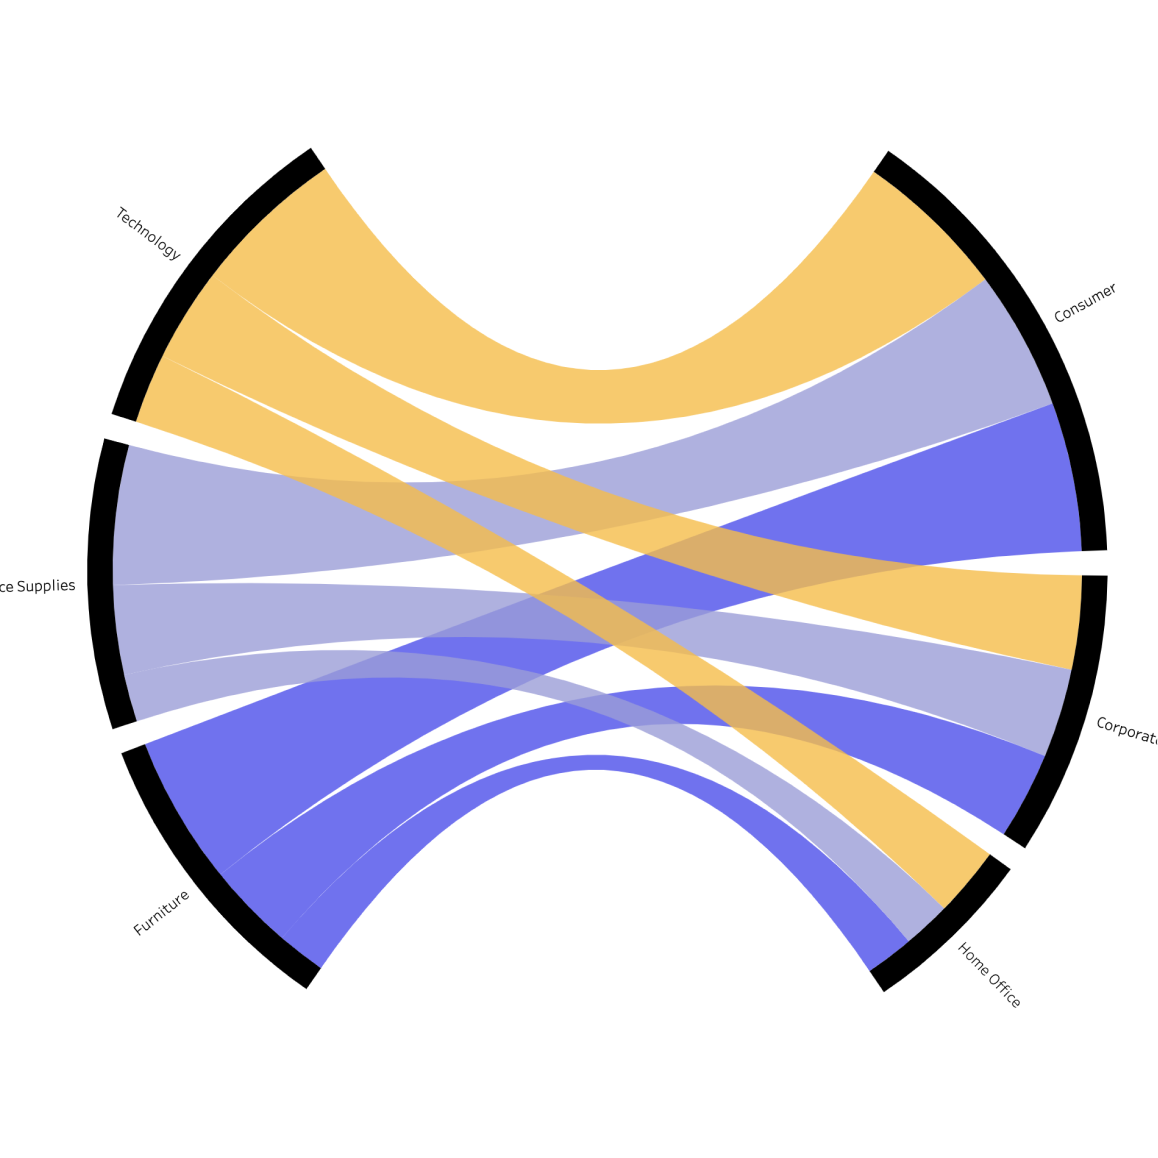
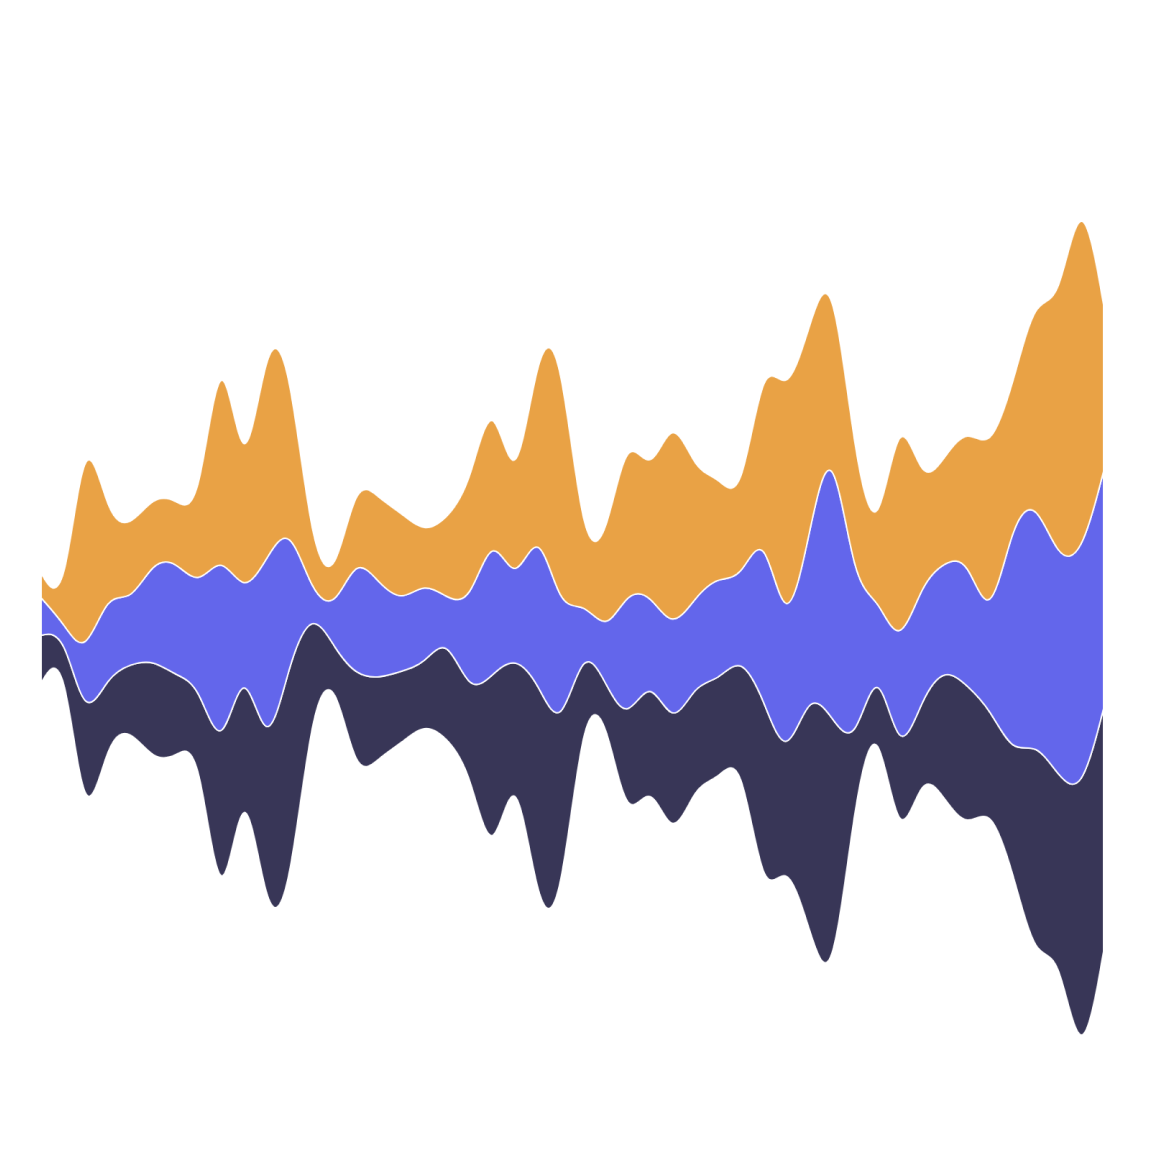
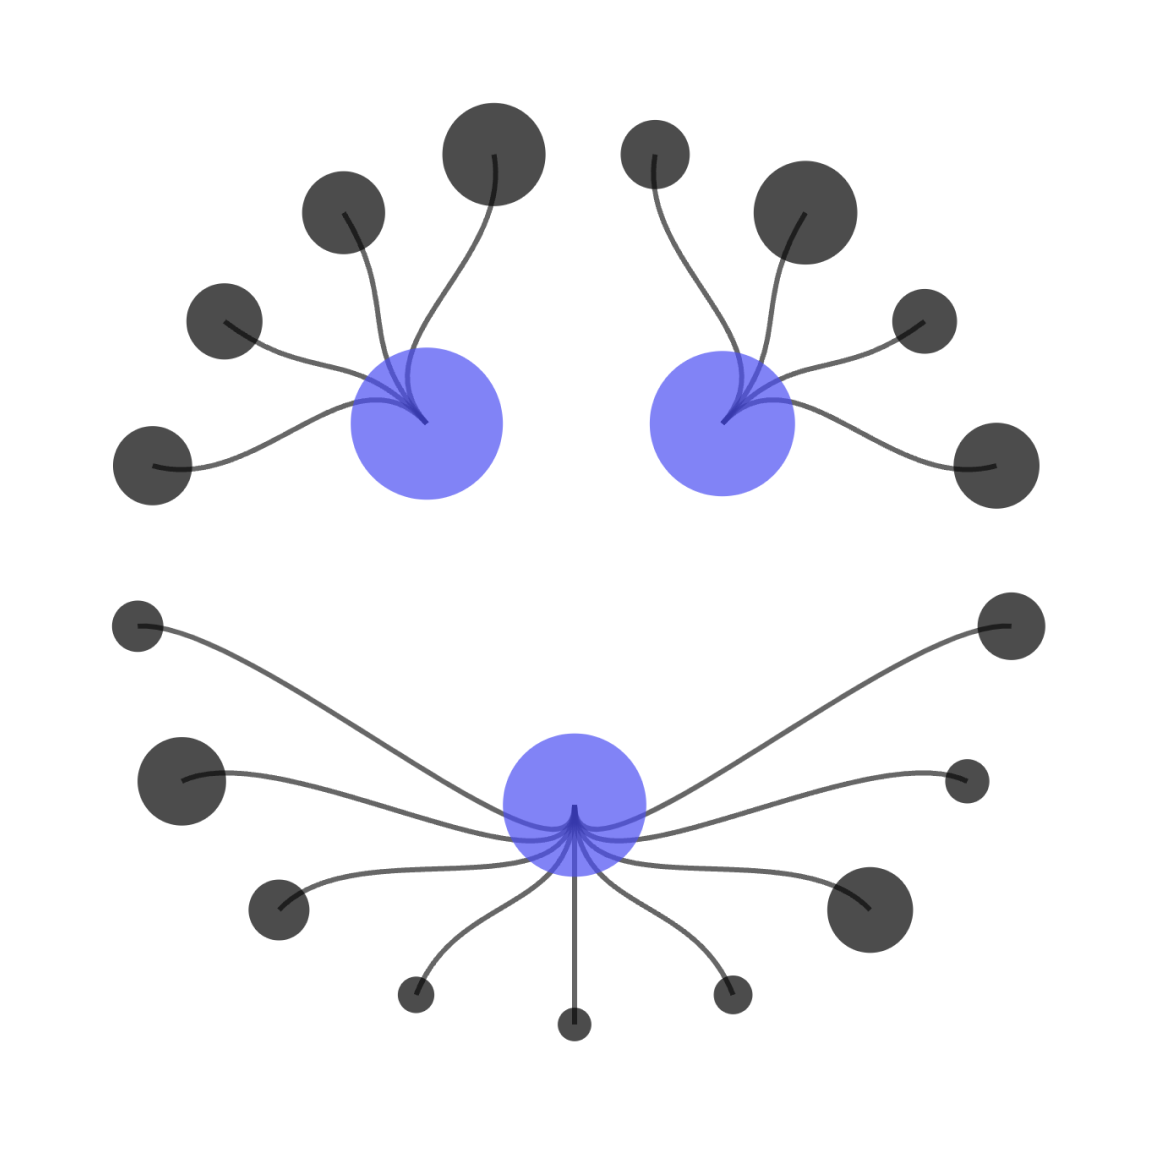
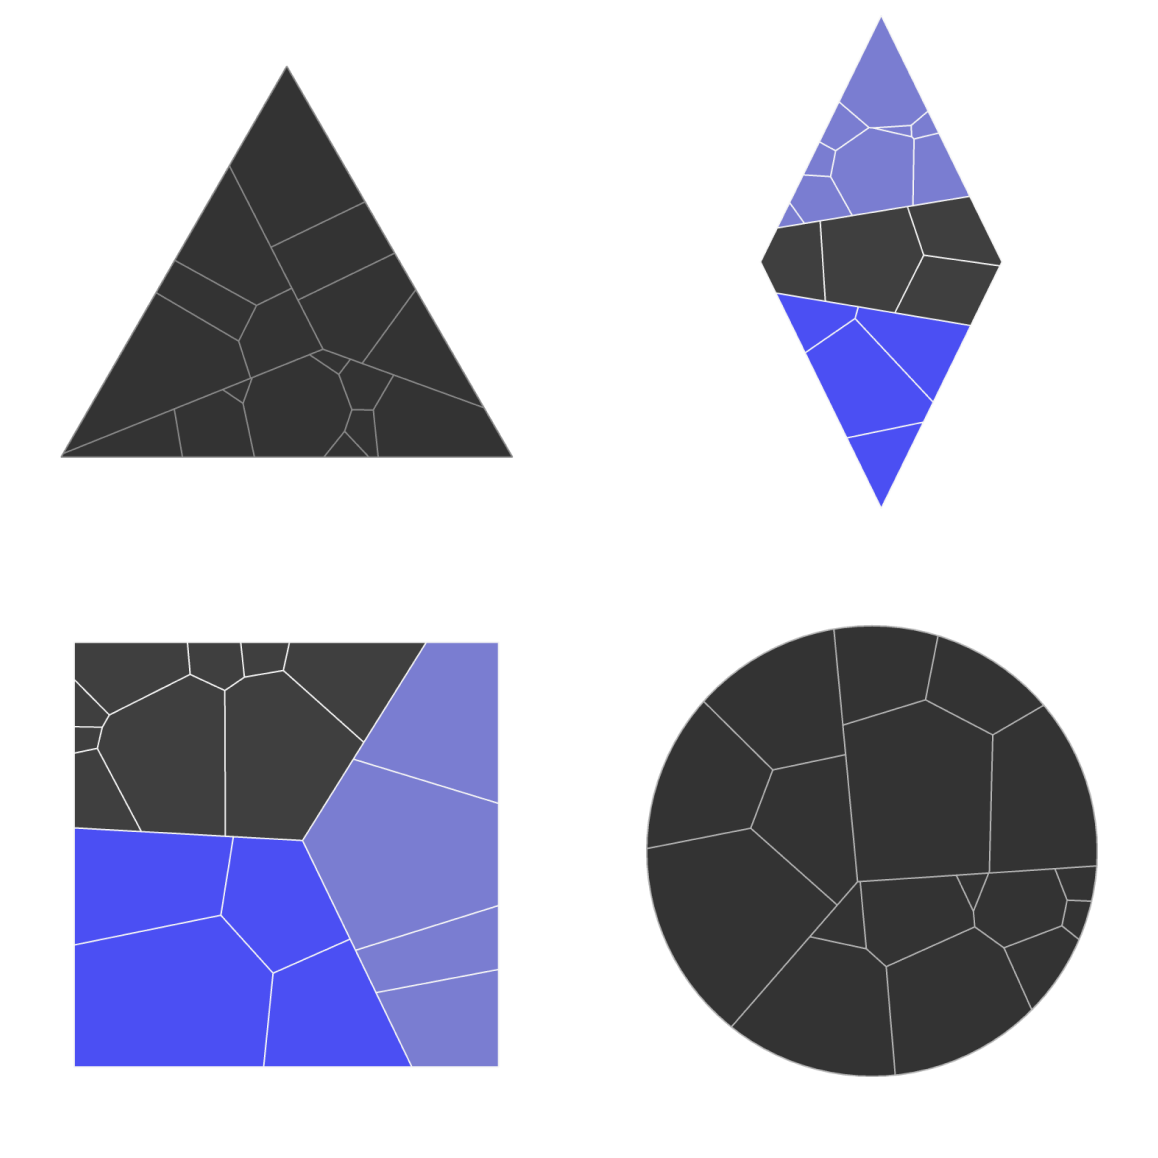
19+ Extensions and Growing
A rich collection of plug-and-play charts and dashboard tools built to push Tableau's native limits. No setup, template, or code needed, just drag-and-drop.
Used in Real Dashboards
These aren't proof-of-concepts or mockups. Our extensions power critical dashboards people rely on every day, in finance, pharma, tech, and more.
Customizable Without Code
The most satisfying extension on the market! Tweak every detail from the extension panel in Tableau, blazing fast.

Official Trusted Partner
Our extensions were thoroughly reviewed and approved by Tableau. Our extensions were the first to be approved for Tableau Public.

Cloud or On-Premise
Use our extensions in Tableau Desktop, Server, or Cloud. Secure by design, we do not store any data, ever. For Enreprise clients, we can host the extensions on-premise, offline in your environment.

Built by Us
No sales team, no calls, no middlemen, and no AI agents. When you reach out, you get direct support and fast updates directly from us.
Extension Catalog
Explore our full collection of advanced visualizations for Tableau


Don't take our word for it, take theirs
“I love the work LaDataViz is doing to make rich visualizations like this even easier in Tableau.“

“1 minute 23 seconds is how long it took to add a tree diagram to a simple Tableau dashboard. All the same capabilities of Tableau! LaDataViz, love the attention to detail on this extension!“

“Playing around with Viz Extensions, just giggled with delight at how easy (and maybe more importantly, fast) it was to make a network chart. Did not have to format my data special or anything, just drag and drop.“

Built for every industry
From Fortune 500 consulting firms to global research universities, our tools and consulting work travel across sectors.
-
Consulting & Professional Services
McKinsey, Accenture, Oliver Wyman, ICF
-
Healthcare & Pharma
Pfizer, Takeda, Guardant Health, Delta Dental
-
Public Sector & NGO
USAID, WIPO (UN), Nashville.gov
-
Sports & Entertainment
NBA, 2K Games, Newcastle United FC, Wargaming
-
Education & Research
Harvard, Stanford, Cambridge, Michigan
-
Retail, Media & Tech
Salesforce, Aldi, Nielsen, Check24, Udacity
Built by a Tableau Visionary studio.


LaDataViz is a two-person studio led by Tristan Guillevin & Jessica Bautista. Tristan is a Tableau Visionary, Iron Viz champion, and Tableau Ambassador, recognitions reserved for a handful of practitioners worldwide.
Our Viz Extensions were thoroughly reviewed and approved by Tableau, and were the first extensions ever allowed on Tableau Public. Every chart type you see in the catalog was shaped by a decade of hands-on dashboard work, so the features, defaults, and customization options match what real teams actually need.
No sales team. No middlemen. No AI agents. When you reach out, you get direct support and fast updates from the people who built the product.
Simple, transparent pricing for everyone
All plans available on our store. Need Enterprise? See enterprise pricing.
Free Extensions
For Desktop and Public
- All features of the paid version
- Perfect to test and build
- Publish to Tableau Public
- Published on Cloud or Server
Free for Tableau Desktop and Tableau Public users. Our trusted extensions are hosted by Tableau directly and updated monthly. Get them on the Tableau Exchange.
Viz Extensions
The extensions and nothing more
- All 19+ extensions
- Future extensions included
- Publish on Cloud & Server
- No installation required
LaDataViz Pro
All tools in one package
- All Viz Extensions
- Figma to Tableau
- BANg
- Filter Manager
- Future products included
Enterprise
On-premise. For large teams
One time payment
- Unlimited users
- On-premise hosting
- No external calls
- All Extensions included
- Custom features
- 1 year of updates included
What counts as a user?
A user is anyone who interacts with a published dashboard (including Tableau viewers, creators and explorers) on a given month. The count resets every month.
Scroll horizontally to compare plans
| Feature | Free | Starter | Growth | Scale | Enterprise | LaDataViz Pro |
|---|---|---|---|---|---|---|
| Use on Tableau Desktop | ✅ | ✅ | ✅ | ✅ | ✅ | ✅ |
| Publish on Tableau Cloud & Server | ❌ | ✅ | ✅ | ✅ | ✅ | ✅ |
| Max Tableau users*/month | 0 | 25* | 100* | 500* | Unlimited | Matches your tier 25 / 100 / 500* |
| On-premise hosting | ❌ | ❌ | ❌ | ❌ | ✅ | ❌ |
| Figma to Tableau Plugin & other tools | ❌ | ❌ | ❌ | ❌ | ❌ | ✅ |
| Best for | Testing | Small teams | Growing teams | Large teams | Enterprises | Advanced users |
We're here to help.
Thanks for reaching out! You'll hear back from me soon.
Oops! Something went wrong while submitting the form.
What are viz extensions?
How does it work?
Where can I use Viz Extensions?
Can the viz extension access my data?
Can I get the Viz Extensions in my secure environment?
Can I use the extensions on Tableau Public?
What is your privacy policy?
Where can I find the license agreement?
I just purchased a license; what do I do now?
Can I get a personalized Viz Extension?
How do I add a Viz Extension to my worksheet?
How to use a Viz Extension?
How do I enable Viz Extensions on my site?
How many Viz Extensions are available?
Are there any known bugs?
We use cookies to measure site usage with Google Analytics. No data is collected until you accept.