Line
Create beautiful and modern Line charts with multiple styles (curves, area, gradients)
Trusted by 1000+ teams, including Tableau themselves.






About Line
Visualize trends and patterns over time like never before with the Line Chart Viz Extension. This extension enables you to plot elegant, customizable line visualizations that transform temporal data into clear, actionable insights within your Tableau dashboards.
Whether you’re tracking sales performance, monitoring KPIs, analyzing seasonal trends, or comparing multiple metrics, this advanced line chart delivers a powerful and flexible way to understand change over time.
Time-series data tells a story, but standard charts often lack the polish and flexibility needed to tell it well. The Line Chart Viz Extension offers sophisticated styling options, from smooth gradient fills to clean, minimalist lines, that help your audience instantly see patterns, peaks, and trends.
See Line in action


Everything you need
- Multiple lines on a single chart for comparisons
- Customizable curve styles (linear, basis, cardinal, etc.)
- Configurable markers and labels
- Interactive hover and selection capabilities
- Support for area charts and gradient fills
When Line shines
- Tracking metrics and KPIs over time
- Comparing multiple trends simultaneously
- Identifying patterns, peaks, and anomalies
Setup in Tableau
Two short phases: add the Viz Extension to your workbook once, then drop the relevant fields on the new Marks Card.
Add the extension to Tableau
- Open the Marks card and choose Add Extension On any Tableau worksheet (Desktop, Cloud or Server), open the Marks card dropdown and select "Add Extension". A new dialog will list available Viz Extensions.
- Pick the Exchange listing or upload the .trex file Either choose "Access Extensions on the Exchange" for the free hosted build, or click "Access local extensions" and upload the .trex file you received with your LaDataViz license.
- Review and accept the data-access prompt Tableau will ask you to allow the extension to read the worksheet's aggregated data. Accept it — a new Viz Extension Marks Card will appear next to Color, Size, Tooltip, etc.
Configure Line
- Drag a Date on Time and one or more Measures on Line.
- Click Format Extension to configure curve style, colors, and area fills.
Enterprise-grade by design
Every LaDataViz Viz Extension is built so your data never leaves Tableau. Here's exactly how we keep it that way.
Ready to add Line to your dashboard?
Related viz extensions
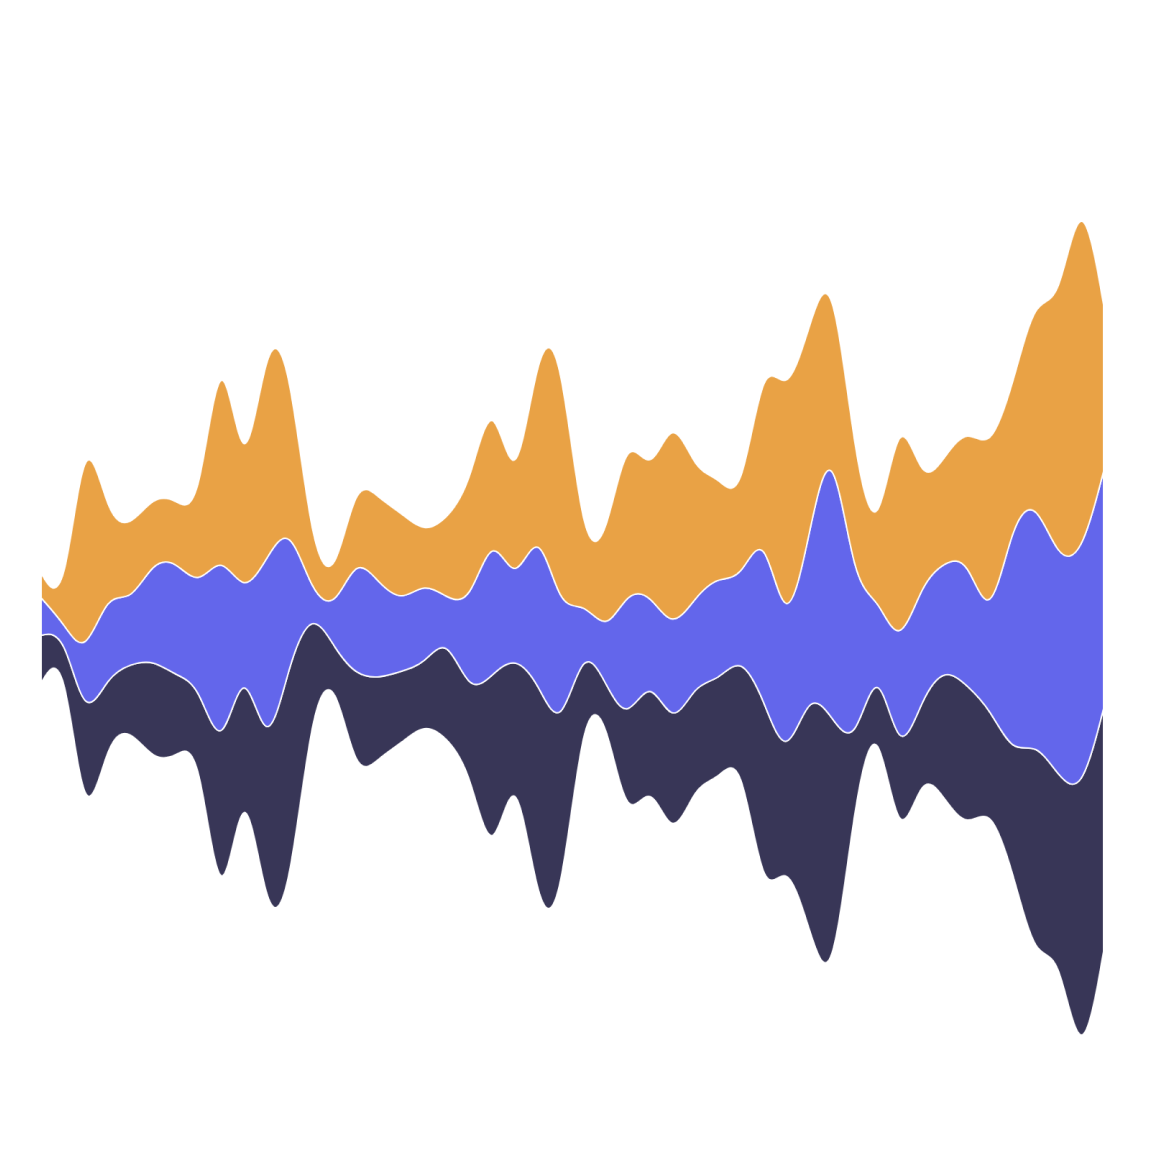
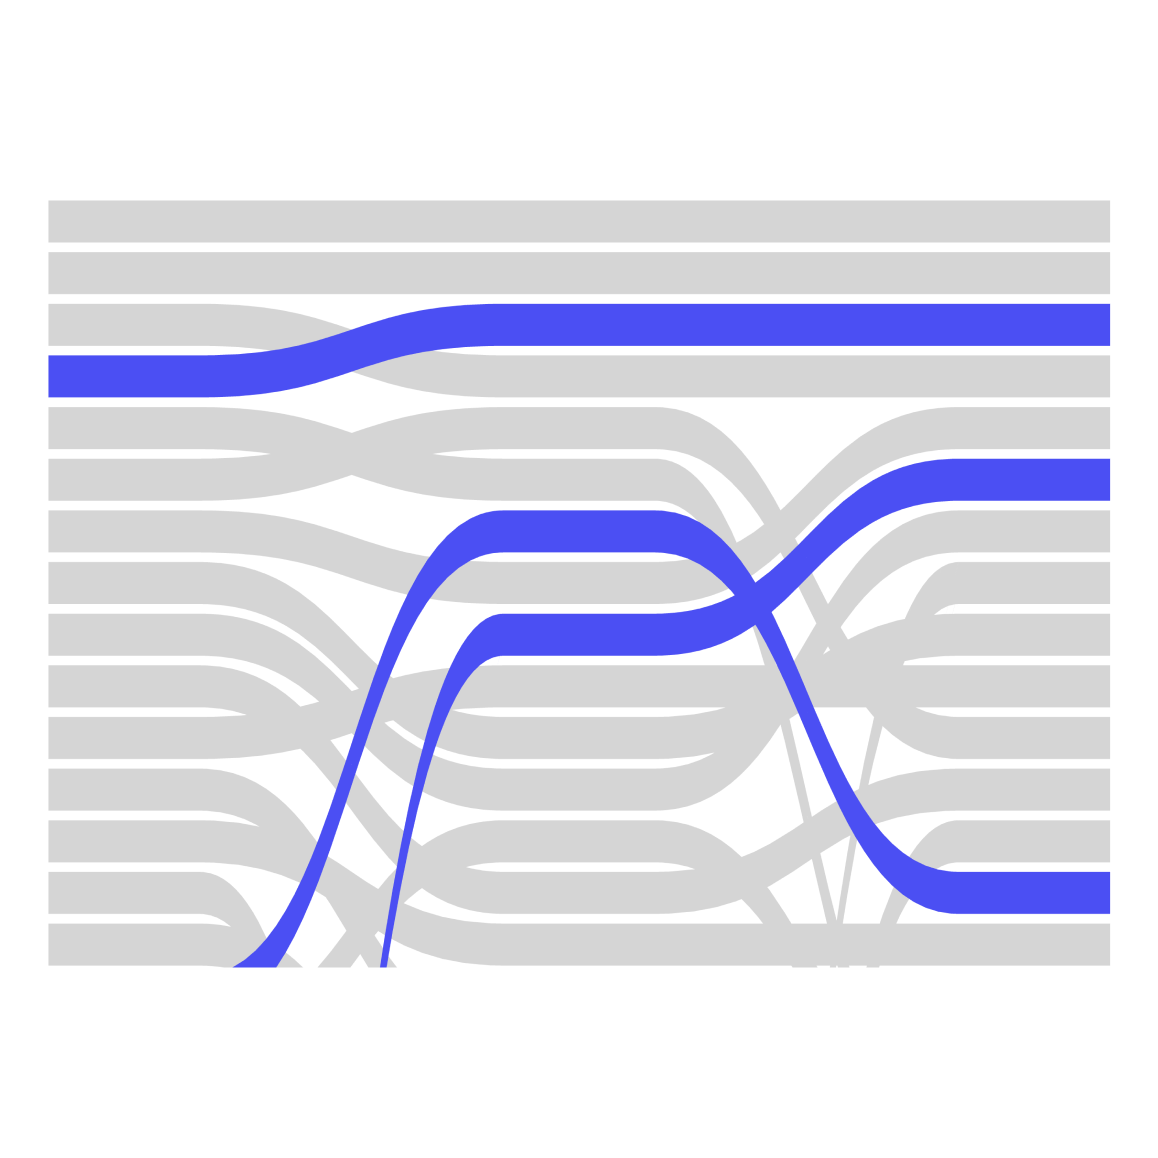
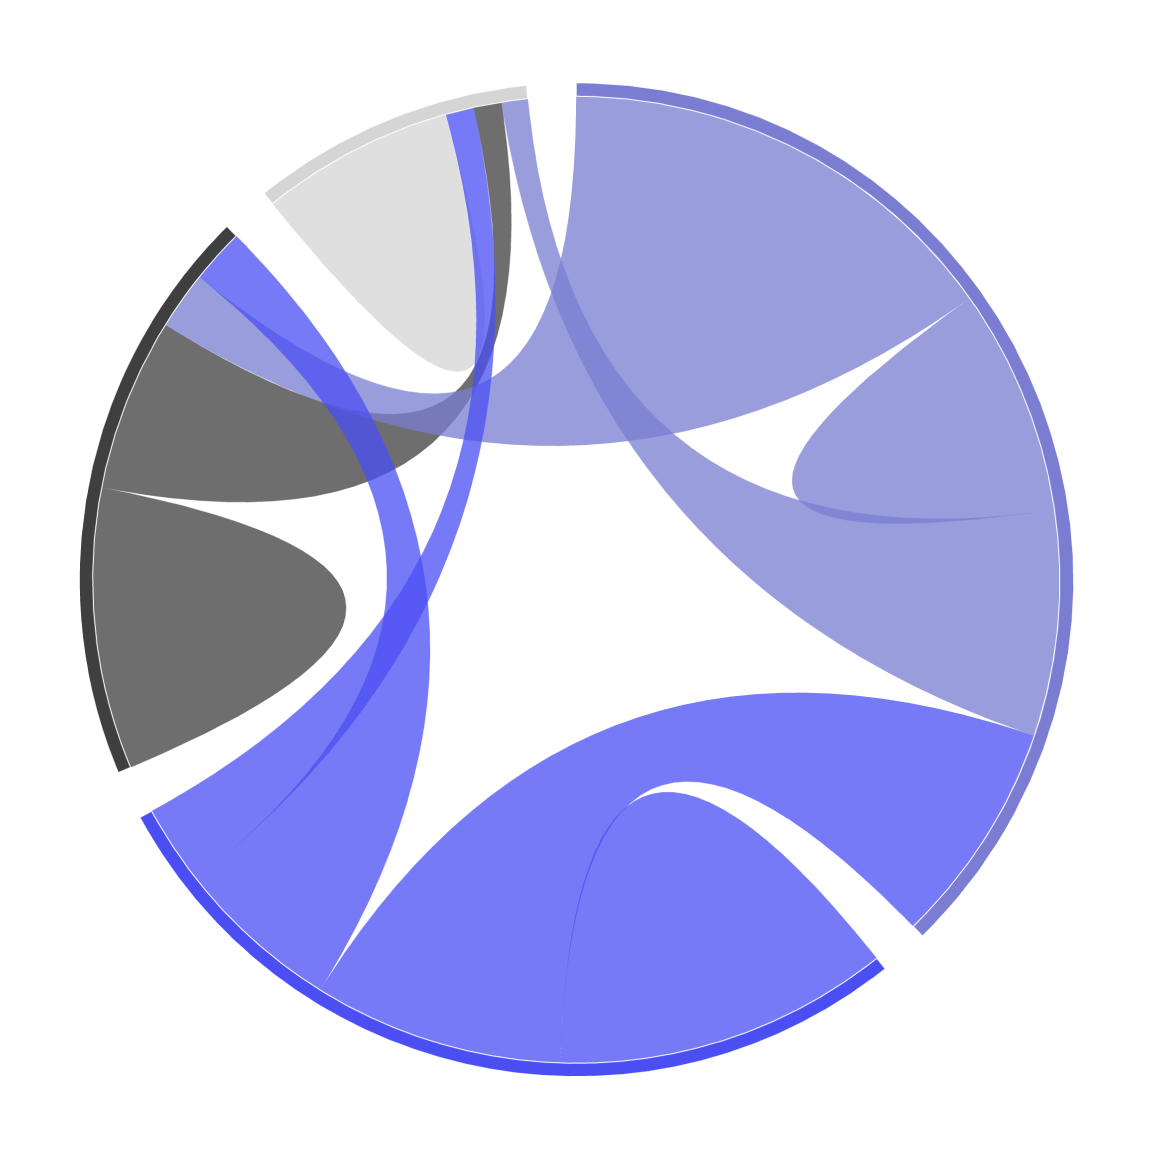
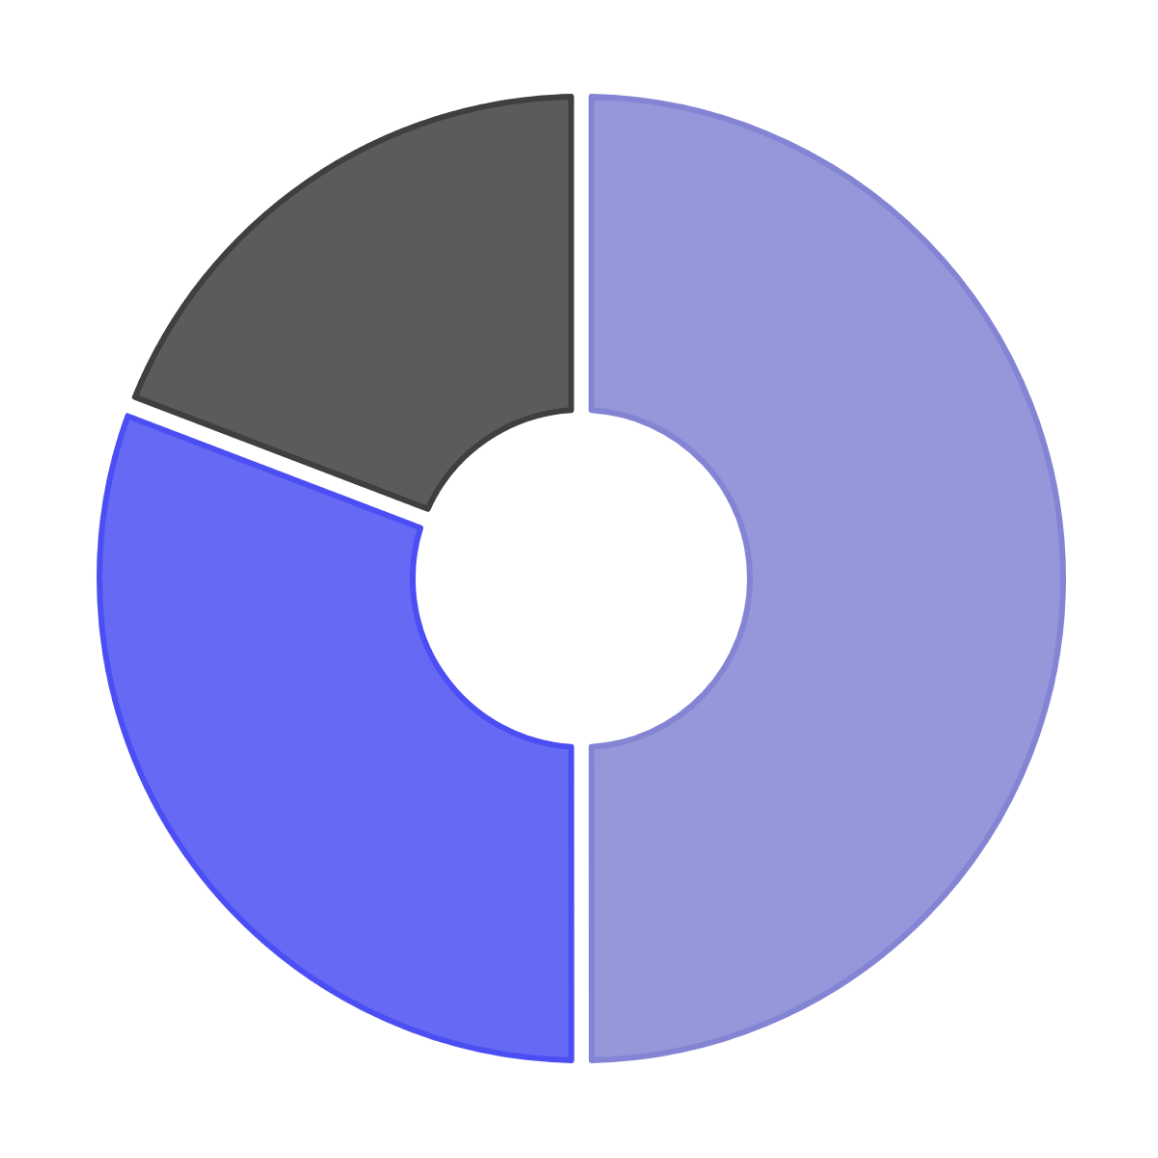
Other extensions in the time-series family.


Questions about Line?
Thanks for reaching out! You'll hear back from me soon.
Oops! Something went wrong while submitting the form.
We use cookies to measure site usage with Google Analytics. No data is collected until you accept.